. 2005 Jan 17;168(2):329-38.
doi: 10.1083/jcb.200410091.

A role for myosin VI in postsynaptic structure and glutamate receptor endocytosis

Affiliations

A role for myosin VI in postsynaptic structure and glutamate receptor endocytosis

Emily Osterweil et al. J Cell Biol. .

Abstract

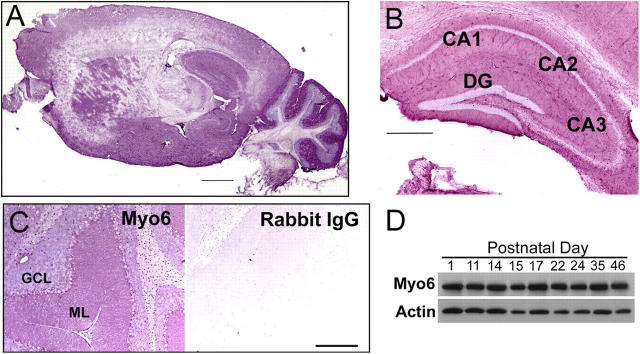
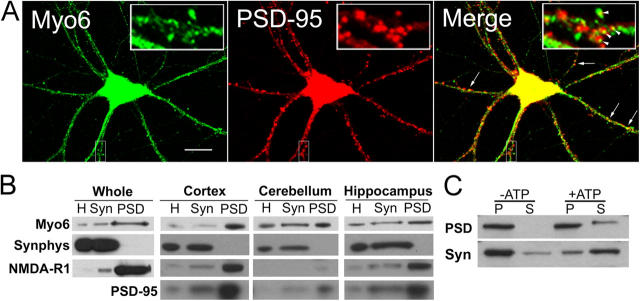
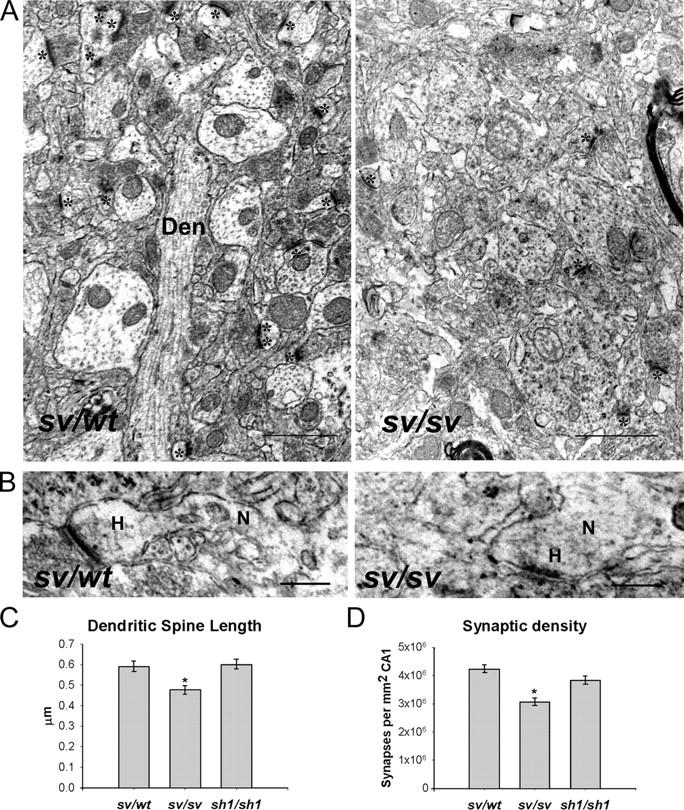
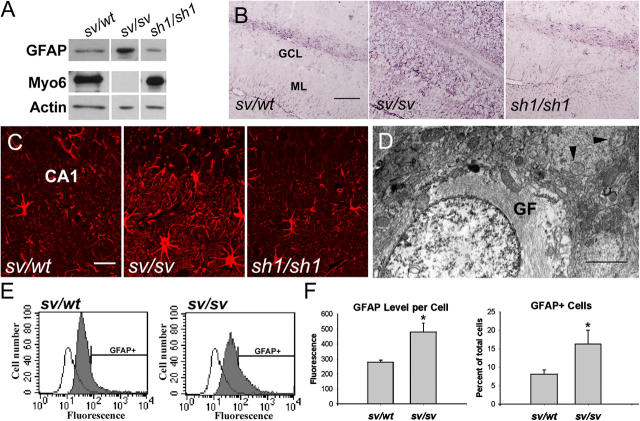
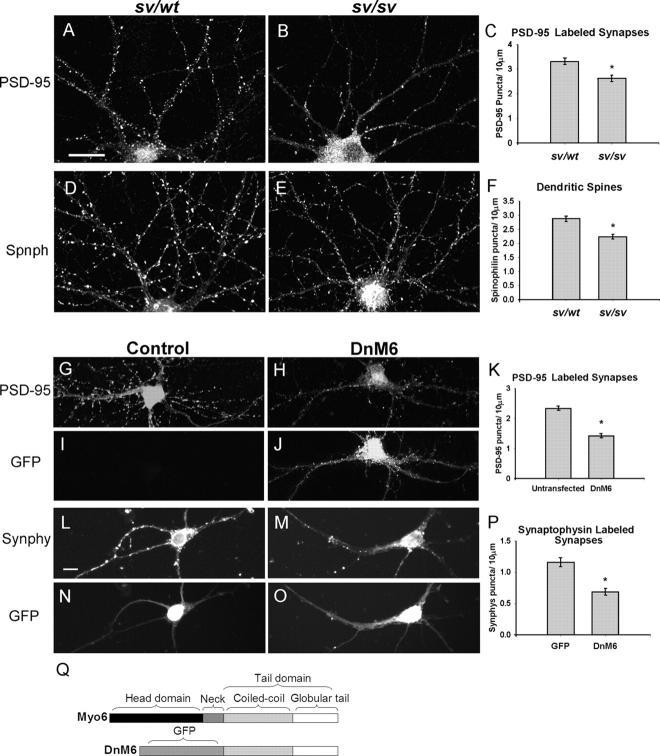
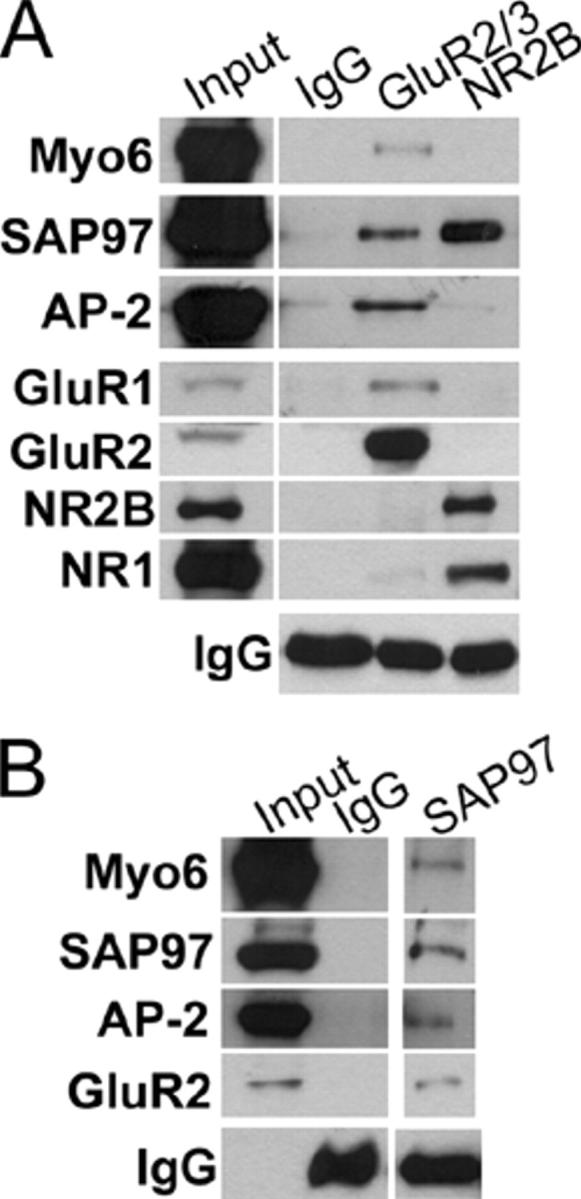
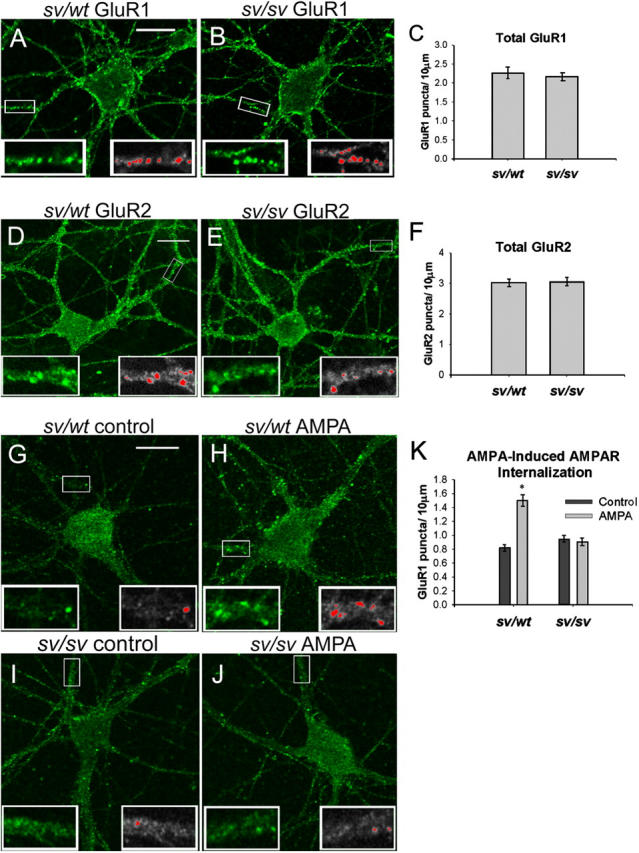
Myosin VI (Myo6) is an actin-based motor protein implicated in clathrin-mediated endocytosis in nonneuronal cells, though little is known about its function in the nervous system. Here, we find that Myo6 is highly expressed throughout the brain, localized to synapses, and enriched at the postsynaptic density. Myo6-deficient (Snell's waltzer; sv/sv) hippocampus exhibits a decrease in synapse number, abnormally short dendritic spines, and profound astrogliosis. Similarly, cultured sv/sv hippocampal neurons display decreased numbers of synapses and dendritic spines, and dominant-negative disruption of Myo6 in wild-type hippocampal neurons induces synapse loss. Importantly, we find that sv/sv hippocampal neurons display a significant deficit in the stimulation-induced internalization of alpha-amino-3-hydroxy-5-methyl-4-isoxazole propionic acid-type glutamate receptors (AMPARs), and that Myo6 exists in a complex with the AMPAR, AP-2, and SAP97 in brain. These results suggest that Myo6 plays a role in the clathrin-mediated endocytosis of AMPARs, and that its loss leads to alterations in synaptic structure and astrogliosis.


Figures

Figure 1.
Figure 1.
Myo6 expression in brain. (A–C) Adult mouse brain sections were stained for Myo6. (A) Sagittal section shows Myo6 is expressed throughout the brain. Higher magnification images of individual brain regions show that Myo6 is highly expressed in (C) the cerebellar molecular (ML) and granule cell (GCL) layers (control nonimmune IgG also shown), and (B) hippocampal areas CA1, CA2, and CA3, and the dentate gyrus (DG). Minimal contrast/brightness adjustment was performed. (D) Western blotting of brain homogenates from mice ages postnatal day 1 to 46 (loaded equal protein) reveals that the expression of Myo6 in whole brain does not change from birth to adulthood. Bars: (A) 1 mm; (B) 0.5 mm; (C) 0.25 mm.
Figure 2.
Figure 2.
Myo6 is partially localized to synapses and associated with the PSD in an actin-independent manner. (A) Hippocampal neurons (at 20 d) were costained for Myo6 and the synapse marker PSD-95, revealing Myo6 localization throughout the cell body and dendrite shaft and in clusters that partially overlap with PSD-95 puncta (arrows). Insets show enlarged regions of dendrite. Arrowheads indicate areas of colocalization. Bar, 10 μm. (B) Western blots of homogenate (H), synaptosome (Syn), and PSD fractions of whole brain, cortex, cerebellum, or hippocampus (equal protein loading) show that Myo6 is enriched in the PSD fraction throughout the brain. Controls for both preparation purity and gel loading included postsynaptically enriched NMDA-R1 and PSD-95, as well as presynaptically enriched synaptophysin (Synphys). Lanes on the same blot are shown separated for easier comparison. (C) Isolated PSD and TX-permeabilized synaptosome (Syn) fractions were incubated in the presence or absence of ATP, and the pellet (P) and supernatant (S) fractions were equal volume loaded. The majority of Myo6 in the PSD fraction, but not the synaptosome fraction, was pelleted despite ATP treatment.
Figure 3.
Figure 3.
Sv/sv mice have fewer synapses and shorter dendritic spines in CA1. (A) Representative images show that sv/sv CA1 displays abnormal morphology, including fewer synapses per square millimeter, than sv/wt CA1. Dendrites (Den) and synapses (*) are labeled. Bars, 1 μm. (B) Dendritic spines in sv/sv CA1 are shorter than those in sv/wt CA1. Dendritic spine heads (H) and necks (N) are labeled. Bars, 0.25 μm. Minimal contrast/brightness adjustment was performed. (D) Quantification of random images reveals that sv/sv CA1 has 27% fewer synapses per square millimeter as compared with sh1/sh1 or sv/wt CA1 (*, P < 0.001; n sv/sv = 87, n sv/wt = 57, and n sh1/sh1 = 77). (C) Length measurements of multiple dendritic spines from sv/wt, sv/sv, and sh1/sh1 CA1 show that sv/sv CA1 dendritic spines are an average of 19% shorter than sh1/sh1 and sv/wt spines (*, P < 0.001; n sv/sv = 94, n sv/wt = 103, and n sh1/sh1 = 98). Error bars indicate SEM.
Figure 4.
Figure 4.
Sv/sv mice display astrogliosis throughout the brain. (A) Western blots of sv/wt, sv/sv, and sh1/sh1 brain homogenates, equal protein loaded, reveal that GFAP is increased fourfold in sv/sv versus sv/wt brain. Densitometric analysis compared the ratios of GFAP to actin between samples. Lanes between those shown were omitted. (B and C) Sv/sv, sv/wt, and sh1/sh1 brain sections were incubated with anti-GFAP, and either peroxidase- (B) or fluorescence (C)-conjugated secondary antibody. Representative images of cerebellum (B) and hippocampus (C) depict the greater GFAP immunoreactivity seen in sv/sv versus sv/wt and sh1/sh1 brains. Granule cell (B, GCL) and molecular layers (B, ML) of the cerebellum and area CA1 of the hippocampus (C) are labeled. Bars: (B) 0.25 mm; (C) 20 μm. Minimal contrast/brightness adjustment was performed. (D) Activated astrocyte exhibiting prominent gliofilaments (GF) characteristic of sv/sv neuropil. Swollen mitochondria (arrowheads) are seen in surrounding cells. Bar, 1 μm. (E) Cells isolated from sv/wt or sv/sv brains were analyzed by flow cytometry. Unstained cells (open peaks) were compared with labeled cells (shaded peaks) and used to determine background fluorescence (not within the GFAP+ region). (F) The proportion of cells within the GFAP+ range and the mean label intensity within this range were compared, and reveal that sv/sv mice have a 2.1-fold increase in GFAP+ astrocytes (*, P < 0.05, n = 4 each) per 100,000 cells and a 1.7-fold increase in GFAP per cell (*, P < 0.02, n = 4 each). Error bars indicate SEM.
Figure 5.
Figure 5.
Myo6-deficient neurons have fewer synapses and dendritic spines. (A–F) Hippocampal neurons (at 14–21 d) from sv/sv and sv/wt embryos were stained for PSD-95 or spinophilin (Spnph). Quantification reveals that sv/sv neurons have 21% fewer PSD-95–labeled synapses (*, P < 0.001; n sv/sv = 147 and n sv/wt = 160) and 22% fewer dendritic spines (*, P < 0.001; n sv/sv = 165 and n sv/wt = 126) than sv/wt neurons. (G–P) Rat hippocampal neurons (at 14 d) were transfected with dnM6 or EGFP. DnM6 expression is concentrated at the cell body and in bright clusters throughout the dendrite. Cultures were stained for PSD-95 (G–J) or synaptophysin (Synphy; L–O). Minimal contrast/brightness adjustment was performed. Quantification revealed the following: neurons expressing dnM6 have (K) 39% fewer PSD-95–labeled synapses than untransfected neurons in the same dish (*, P < 0.001; n dn = 146 and n un = 148) and (P) 41% fewer synaptophysin-labeled synapses than neurons expressing EGFP (*, P < 0.001; n dn = 126 and n GFP = 93). (Q) Schematic of Myo6 domain structure. DnM6 contains an EGFP tag NH2-terminal to the tail of Myo6. Bars, 10 μm. Error bars indicate SEM.
Figure 6.
Figure 6.
Myo6 exists in a complex with the AMPAR, AP-2, and SAP97 in rat brain. (A) IP of the AMPAR from DOC-extracted rat brain brings down Myo6, SAP97, and AP-2. Both GluR2 and GluR1 subunits are present in this complex. Myo6 does not coimmunoprecipitate with the NR2B and NR1 subunits of the NMDAR, despite the presence of SAP97 in this complex. (B) SAP97 immunoprecipitates a complex containing Myo6, AP-2, and the AMPAR. IPs done with equal amounts of nonimmune IgG are devoid of Myo6. Input lanes are 0.1 vol relative to IP lanes.
Figure 7.
Figure 7.
Sv/sv hippocampal neurons display dysfunctional AMPA-induced AMPAR internalization. (A–F) Total GluR1 (n sv/wt = 183 and n sv/sv = 173) or GluR2 (n sv/sv = 114 and n sv/wt = 115) was measured in unstimulated neurons by permeabilization and incubation with secondary antibody, and both were found to be the same in sv/wt and sv/sv neurons. (G–J) GluR1 antibody was applied for 10 min, followed by 1 μM TTX ± 100 μM AMPA for 15 min. Internalized AMPARs were assessed after incubation with acetic acid followed by permeabilization and secondary incubation. (K) AMPA treatment induces an 83% increase in internalized AMPARs in sv/wt neurons (*, P < 0.001; n con = 171 and n AMPA = 156), but no increase in sv/sv neurons (n con = 148 and n AMPA = 125). Bars, 10 μm. Error bars indicate SEM. Insets show (left) enlarged areas of dendrite and (right) puncta counted (red) based on thresholding of images. Minimal contrast/brightness adjustment was performed.
Figure 8.
Figure 8.
Sv/sv hippocampal neurons display dysfunctional insulin-induced AMPAR internalization identical to the disruption of clathrin-mediated endocytosis. (A–F) Anti-GluR1 was applied for 10 min, followed by 1 μM TTX ± 10 μM insulin for 15 min. Clathrin-mediated endocytosis was disrupted with a 10-min incubation in 0.45 M sucrose before stimulation. Internalized AMPARs were assessed after incubation with acetic acid followed by permeabilization and secondary incubation. Minimal contrast/brightness was performed. Insets show puncta counted (red) based on thresholding of images. (G) Insulin treatment induces a 106% increase in internalized AMPARs in sv/wt neurons (*, P < 0.001; n con = 139 and n ins = 170), but no change in sv/sv neurons (n con = 161 and n ins = 110). (E and F) Inhibition of clathrin-mediated endocytosis diminishes AMPAR internalization to control levels in insulin-stimulated sv/wt neurons (n ins + suc = 188), but does not affect insulin-stimulated sv/sv neurons (n ins + suc = 159). Insets show (left) enlarged areas of dendrite and (right) puncta counted based on thresholding of images. Minimal contrast/brightness was performed. (H–J) Dendritic uptake of Alexa 568–labeled Tf is similar in sv/wt and sv/sv neurons (n sv/sv = 273 and n sv/wt = 215). Insets show (left) enlarged areas of dendrite and (right) puncta counted (red) based on thresholding of images. Minimal contrast/brightness was performed. Bars, 10 μm. Error bars indicate SEM.

Similar articles

Cited by

References

    1. Allison, D.W., V.I. Gelfand, I. Spector, and A.M. Craig. 1998. Role of actin in anchoring postsynaptic receptors in cultured hippocampal neurons: differential attachment of NMDA versus AMPA receptors. J. Neurosci. 18:2423–2436. - PMC - PubMed
    1. Aschenbrenner, L., T. Lee, and T. Hasson. 2003. Myo6 facilitates the translocation of endocytic vesicles from cell peripheries. Mol. Biol. Cell. 14:2728–2743. - PMC - PubMed
    1. Avraham, K.B., T. Hasson, K.P. Steel, D.M. Kingsley, L.B. Russell, M.S. Mooseker, N.G. Copeland, and N.A. Jenkins. 1995. The mouse Snell's waltzer deafness gene encodes an unconventional myosin required for structural integrity of inner ear hair cells. Nat. Genet. 11:369–375. - PubMed
    1. Berg, J.S., B.C. Powell, and R.E. Cheney. 2001. A millennial myosin census. Mol. Biol. Cell. 12:780–794. - PMC - PubMed
    1. Biemesderfer, D., S.A. Mentone, M. Mooseker, and T. Hasson. 2002. Expression of myosin VI within the early endocytic pathway in adult and developing proximal tubules. Am. J. Physiol. Renal Physiol. 282:F785–F794. - PubMed

Publication types

MeSH terms

Substances