. 2005 Feb;25(3):1025-40.
doi: 10.1128/MCB.25.3.1025-1040.2005.

Inhibition of macroautophagy triggers apoptosis

Affiliations

Inhibition of macroautophagy triggers apoptosis

Patricia Boya et al. Mol Cell Biol. 2005 Feb.

Abstract

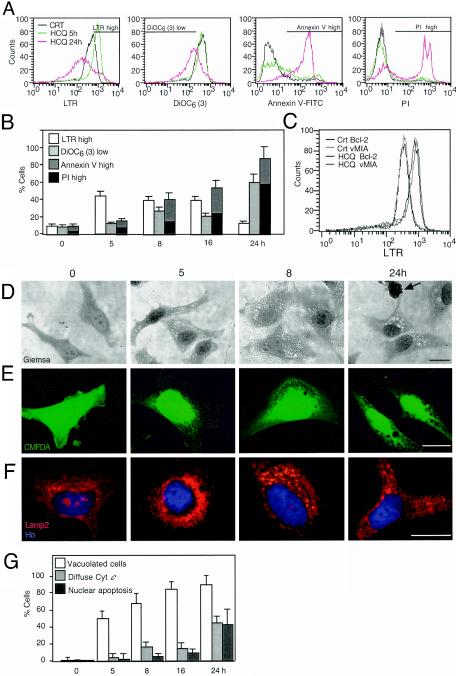
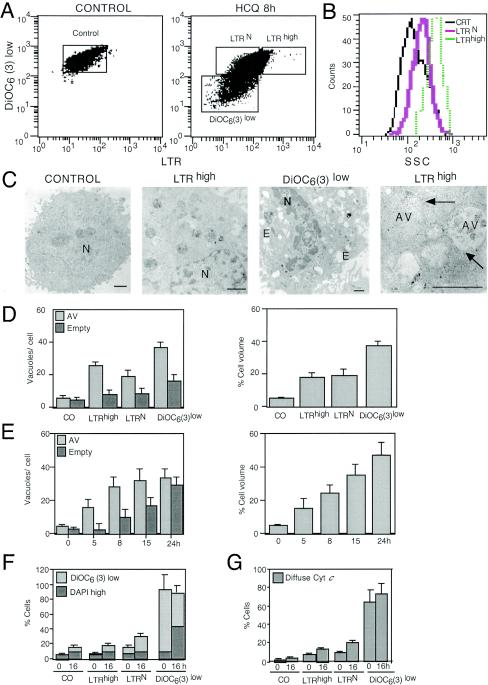
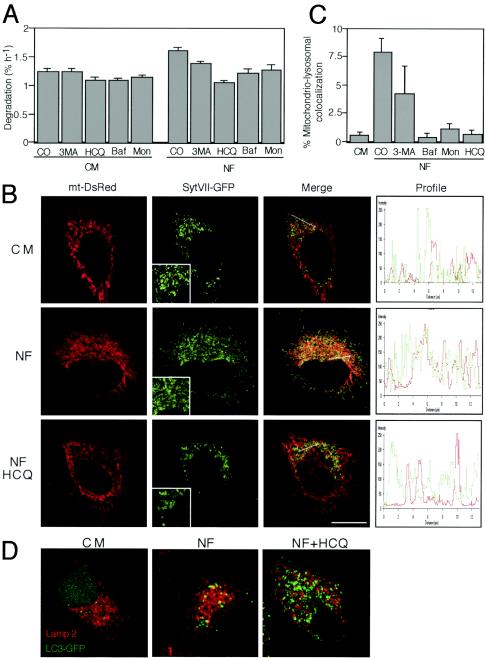
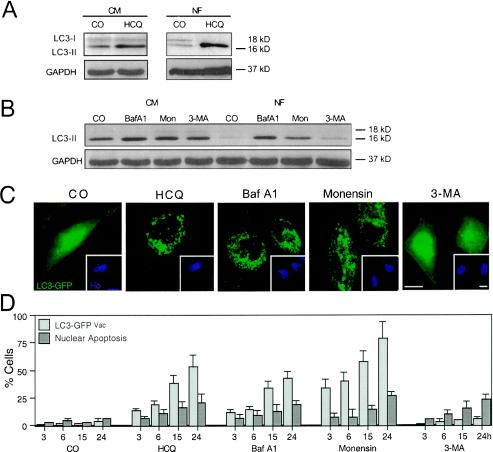
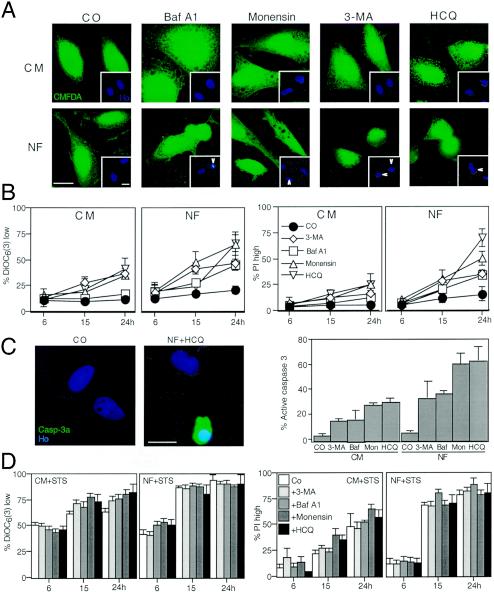
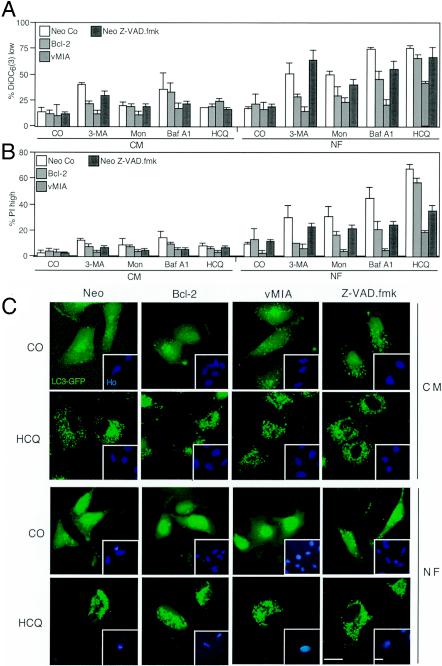
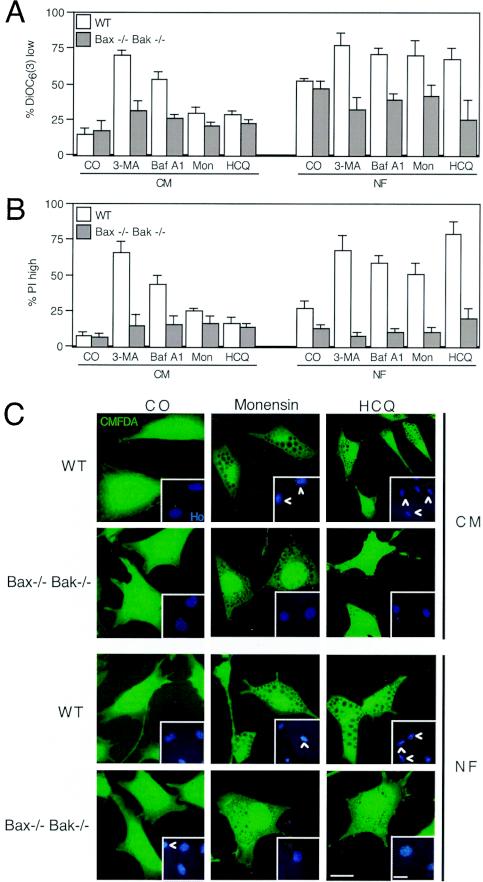
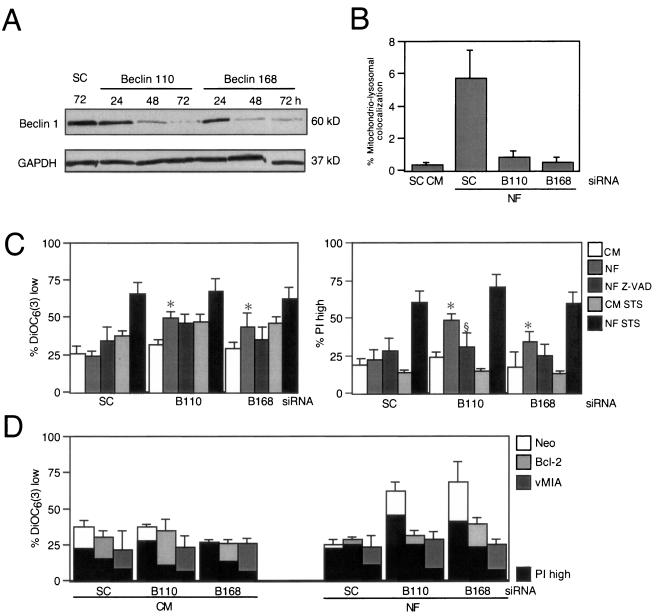
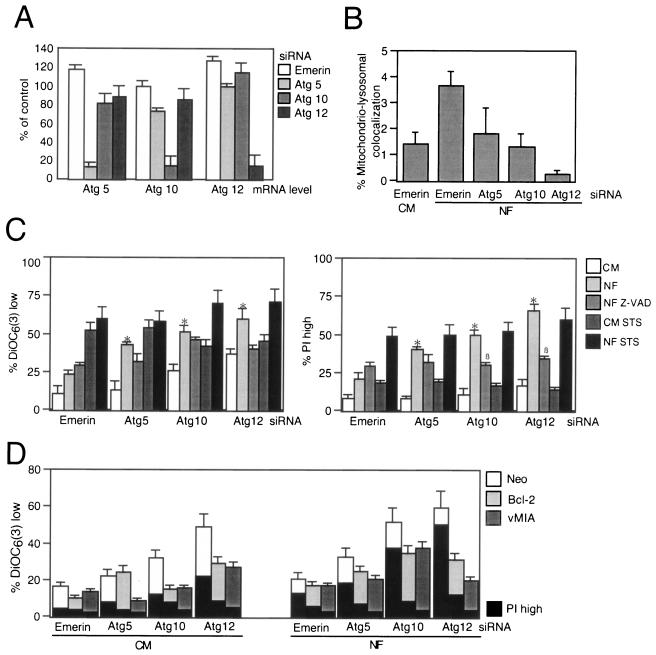
Mammalian cells were observed to die under conditions in which nutrients were depleted and, simultaneously, macroautophagy was inhibited either genetically (by a small interfering RNA targeting Atg5, Atg6/Beclin 1-1, Atg10, or Atg12) or pharmacologically (by 3-methyladenine, hydroxychloroquine, bafilomycin A1, or monensin). Cell death occurred through apoptosis (type 1 cell death), since it was reduced by stabilization of mitochondrial membranes (with Bcl-2 or vMIA, a cytomegalovirus-derived gene) or by caspase inhibition. Under conditions in which the fusion between lysosomes and autophagosomes was inhibited, the formation of autophagic vacuoles was enhanced at a preapoptotic stage, as indicated by accumulation of LC3-II protein, ultrastructural studies, and an increase in the acidic vacuolar compartment. Cells exhibiting a morphology reminiscent of (autophagic) type 2 cell death, however, recovered, and only cells with a disrupted mitochondrial transmembrane potential were beyond the point of no return and inexorably died even under optimal culture conditions. All together, these data indicate that autophagy may be cytoprotective, at least under conditions of nutrient depletion, and point to an important cross talk between type 1 and type 2 cell death pathways.


Figures

FIG. 1.
FIG. 1.
HCQ-mediated induction of acidic vacuoles. (A and B) Vacuolar acidic compartment- and apoptosis-associated parameters in HCQ-treated cells. HeLa cells were exposed to HCQ (30 μg/ml) for the indicated periods, and cells were stained with LTR, DiOC6(3), annexin V-fluorescein isothiocyanate, or PI, followed by FACS analysis. Data shown are representative FACS profiles (A) or means of results from five independent experiments (x ± standard errors of the mean [SEM]) (B). Bars in panel A indicate the window representing each population. CRT, control. (C) Effect of mitochondrion-stabilizing proteins on LTR staining. HeLa cells stably transfected with Bcl-2 or vMIA were incubated for 5 h with HCQ, followed by LTR staining and FACS analysis. Vector-only control cells (unpublished results) behaved as cells for which results are shown in the leftmost graph of panel A. (D and E) Light microscopic evidence for HCQ-induced vacuolization. Cells treated with HCQ for the indicated periods were stained with Giemsa (D) or Cell Tracker Green CMFDA (E). The arrow indicates the apoptotic nucleus. (F) Staining of lysosomes with a LAMP2 antibody. HCQ-treated HeLa cells were immunofluorescence stained and counterstained with Hoechst 33324. (G) Chronological hierarchy of vacuolization and MMP. Cells were stained with CMFDA, an anti-cytochrome c (Cyt c) antibody (revealed as red fluorescence), and Hoechst 33342 (blue fluorescence), and the frequencies of cells with enhanced vacuolization, mitochondrion-released cytochrome c, and apoptotic nuclei were determined (x ± SEM; n = 4).
FIG. 2.
FIG. 2.
Determination of the point of no return of HCQ-induced cell death. (A) Cytofluorometric purification of subpopulations. Cells left untreated (control) or treated with HCQ (8 h, 60 μg/ml) were simultaneously stained with LTR, DiOC6(3), and the vital dye DAPI. The cells (gated on DAPIlow events with normal forward scatter) were then subjected to FACS. The gates shown in panels A indicate the FACS-sorted populations [control, cells incorporating normal levels of LTR (LTRN), LTRhigh, and DiOC6(3)low cells]. Note that the definition of LTRhigh cells is more restrictive than in Fig. 1A. (B) Side scatter characteristics (SSC) of cells sorted in panels A. CRT, control. (C) Representative electron microscopic images obtained from such sorted cells as shown in panels A and B. Bars indicate 1 μm. E, empty vesicle; N, nucleus. Arrows indicate double membranes. (D) Quantitation of vacuolization patterns as determined by electron microscopy (50 replicates). Either the number of vesicles (autophagic vesicles, AV, or empty vesicles) per cell was determined or the percentage of the cell volume occupied by vesicles was measured by morphometry. CO, control. (E) Quantitation of vacuolization patterns of cells exposed to HCQ (60 μg/ml) without FACS purification. (F and G) Mortality of FACS-purified populations. Cells purified as described for panels A were either restained with DiOC6(3) and DAPI immediately after FACS purification or cultured for another 16 h, followed by DiOC6(3) and DAPI staining (F). Note that only the DiOC6(3)low population tends to lose its viability and to become DAPIhigh. Alternatively, cells were centrifuged on slides and subjected to immunofluorescent staining (0 h) or recultured for 16 h and then labeled with a cytochrome c-specific antibody (G). The frequency of cells with a diffuse staining pattern indicative of mitochondrial cytochrome c release is indicated in panels D (x ± SEM; n = 3).
FIG. 3.
FIG. 3.
HCQ inhibits autophagy. (A) Effect of HCQ on protein degradation. The rate of (54) valine-labeled long-lived proteins was measured in cells incubated in either CM or NF, alone or in the presence of the indicated autophagy inhibitors. CO, control; Baf, Baf A1; Mon, monensin. (B) Effect of HCQ on the colocalization of mitochondria and lysosomes. Cells were transfected with mtDsRed and lysosome-targeted GFP (SytVII-GFP). Twenty-four hours later, cells were treated with NF (2 h) in the presence or absence of HCQ, and the cells were subjected to confocal laser microscopy. Inserts illustrate the increased size of SytVII-GFP-marked structures in HCQ-treated, nutrient-depleted cells. The graphs (right panels) represent the fluorescence distribution determined for sections of the cell, as indicated by the orientation of the arrow. (C) Quantitation of mitochondrial-lysosomal colocalization. Percentage overlaps were calculated with an image analyzer and plotted for control cells (in CM) or cells starved (in NF) in the presence of the indicated autophagy inhibitors. For results with control versus 3-MA-treated cells, P was <0.05; for results with control versus Baf A1-, monensin-, and HCQ-treated cells, P was <0.001. (D) Inhibitory effect of HCQ on the colocalization of LAMP2 and LC3-GFP. Cells transfected with LC3-GFP (24 h before the initiation of the experiment) were subjected to nutrient starvation (NF, 2 h) in the absence or presence of HCQ (30 μg/ml) and immunostained for LAMP2 detection to visualize the overlap with LC3-GFP (yellow). Representative images are shown.
FIG. 4.
FIG. 4.
Effect of HCQ and other autophagy inhibitors on the subcellular localization and biochemical status of the autophagic vacuole marker LC3. (A and B) Immunoblot analyses of accumulating LC3-II protein in control (CM) and starved (NF, 6 h) cells treated with HCQ (A) or a range of established autophagy inhibitors (B). (C and D) Redistribution of LC3-GFP. Twenty-four hours after transient transfection with an LC3-GFP chimera, cells were treated for the indicated times (24 h in panels C in the presence of serum) with HCQ, Baf A1, monensin, or 3-MA; fixed; and counterstained with Hoechst 33342. Representative cells are shown in panels C, and the frequency (x ± SEM; n = 4) of cells with a clear vacuolar distribution of LC3-GFP (LC3-GFPVac) or apoptotic nuclei was scored. CO, control; Mon, monensin.
FIG. 5.
FIG. 5.
Autophagy inhibition sensitizes cells to nutrient depletion-induced cell death. (A) Vacuolization induced by starvation plus autophagy inhibition. HeLa cells were cultured in CM or NF for 24 h in the presence or absence (control [CO]) of HCQ, Baf A1, monensin, or 3-MA and finally stained with CMFDA and Hoechst 33342 (inset). Note that HCQ, Baf A1, and monensin enhance the formation of AV (visible as holes in the green fluorescent staining) and induce nuclear apoptosis. Arrows mark apoptotic nuclei. (B) Quantitative assessment of synergic cell death induction. Cells cultured in CM or NF, in the presence of the indicated inhibitors or none of them (control), were stained to determine the loss of ΔΨm [with DiOC6(3)] and viability (with PI). Data shown are means of results of five independent experiments ± SEM. (C) Caspase-3 activation (Casp-3a) triggered by nutrient depletion plus autophagy inhibition. Cells were stained with an antibody recognizing the 17-kDa subunit of activecaspase-3, and the frequency of positive cells was scored after culture in the presence or absence of nutrient and autophagy inhibitors (as described for panel B, at 24 h). Ho, Hoechst 33342; Baf, Baf A1; Mon, monensin. (D) Autophagy inhibition does not sensitize cells to STS-induced cell death. Cells were cultured with 100 nM STS in the presence of the indicated inhibitors, and cell death-related parameters were measured as described for panels B. Results are mean values ± SEM of three to five independent determinations.
FIG. 6.
FIG. 6.
Effect of apoptosis inhibitors on starvation-induced cell death occurring in autophagy-inhibited cells. (A and B) Effect of the inhibitors on cell death markers. HeLa cells stably transfected with vector only (Neo), left untreated (Neo Co), or treated with the pan-caspase inhibitor Z-VAD-fmk human or cells transfected with Bcl-2 or cytomegalovirus-derived vMIA were cultured under the indicated conditions (not starved in CM and starved in NF) in the absence (control [CO]) or presence of the indicated autophagy inhibitors for 24 h. Then, the percentages of cells (x ± SEM; n = 4) with low-level DiOC6(3) incorporation (A) and PI-permeable plasma membranes (B) were determined by cytofluorometry. Mon, monensin. (C) Apoptosis inhibition does not affect the accumulation of autophagosomes. Cells (Neo-, Bcl-2-, or vMIA-transfected cells as described for panels B and C) were transfected with the LC3-GFP chimera and then treated with HCQ (24 h) in the presence (CM) or absence (NF) of serum, and in the presence of Z-VAD-fmk where indicated, followed by counterstaining with Hoechst 33342 (Ho) and fluorescent microscopy.
FIG. 7.
FIG. 7.
DKO of Bax and Bak protects against starvation-induced cell death exacerbated by autophagy inhibition. Wild-type (WT) mouse embryonic fibroblasts or Bax and Bak DKO (Bax−/− Bak−/−) fibroblasts were cultured in CM or NF and incubated with 3-MA, Baf A1, monensin (Mon), or HCQ for 24 h and then stained with a low concentration of DiOC6(3) (A) or a high concentration of PI (B), followed by cytofluorometric analysis (x ± SEM; n = 3). Alternatively, cells were stained with CMFDA and Hoechst 333234 and observed under fluorescence microscopy. Representative images for monensin- and HCQ-treated cells (in CM or NF) are shown. CO, control.
FIG. 8.
FIG. 8.
siRNA of Beclin 1 sensitizes cells to starvation-induced cell death. (A) siRNA-induced downregulation of Beclin 1, determined by immunoblotting at the indicated times after treatment with scrambled control (SC) siRNA or two different Beclin 1-1-targeted double-stranded oligoribonucleotides. (B) Effect of Beclin 1-specific siRNA on the colocalization of mitochondria (DsRed labeled) or lysosomes (GFP labeled) after culture in NF. The degree of colocalization (x ± SEM; n = 12) was determined as described for Fig. 3. (C and D) Beclin 1 knockdown sensitizes cells to nutrient depletion-induced cell death. HeLa cells that were either wild type (C) or transfected with the neomycin resistance gene, vMIA, or Bcl-2 (D) were exposed to the indicated siRNA and then cultured for 24 h in nutrient-rich (CM) or nutrient-deficient (NF) medium, in the presence (C) or absence (C and D) of Z-VAD-fmk (Z-VAD) or STS (15 h) followed by DiOC6(3) or PI staining (x ± SEM; n = 4). *, P was <0.05 versus values with CM; §, P < 0.05 versus values with NF.
FIG. 9.
FIG. 9.
Targeting of Atg genes enhances the lethality of nutrient depletion. (A) Reduction of mRNA levels by Atg-specific siRNA. After treatment with the indicated siRNA, the level of mRNA was determined by quantitative RT-PCR after 24 h. Results (x ± SEM; n = 3) are expressed as percentages, with 100% being considered the mRNA level of untreated control cells. (B) Effect of Atg-specific siRNA on the colocalization of mitochondria and lysosomes determined as described for Fig. 3B. (C and D) Apoptosis inhibition reduces cell death induced by starvation plus Atg depletion. Cells with the indicated genotype (wild type in panel C; Neo, Bcl-2, or vMIA in panel D) were treated with diverse siRNA constructs (24 h) and then starved for nutrients and/or treated with Z-VAD-fmk (Z-VAD) or STS. Data result from cytofluorometric analyses of DiOC6(3)- or PI-stained cells (x ± SEM; n = 4). *, P was <0.05 versus values with CM; §, P was <0.05 versus values with NF.

References

    1. Adams, J. M. 2003. Ways of dying: multiple pathways to apoptosis. Genes Dev. 17:2481-2495. - PubMed
    1. Beers, M. F. 1996. Inhibition of cellular processing of surfactant protein C by drugs affecting intracellular pH gradients. J. Biol. Chem. 271:14361-14370. - PubMed
    1. Belzacq, A. S., C. El Hamel, H. L. A. Vieira, I. Cohen, D. Haouzi, D. Métivier, P. Marchetti, V. Goldmacher, C. Brenner, and G. Kroemer. 2001. The adenine nucleotide translocator mediates the mitochondrial membrane permeabilization induced by lonidamine, arsenite and CD437. Oncogene 20:7579-7587. - PubMed
    1. Blommaart, E. F., U. Krause, J. P. Schellens, H. Vreeling-Sindelarova, and A. J. Meijer. 1997. The phosphatidylinositol 3-kinase inhibitors wortmannin and LY294002 inhibit autophagy in isolated rat hepatocytes. Eur. J. Biochem. 243:240-246. - PubMed
    1. Bowman, E. J., A. Siebers, and K. Altendorf. 1988. Bafilomycins: a class of inhibitors of membrane ATPases from microorganisms, animal cells, and plant cells. Proc. Natl. Acad. Sci. USA 85:7972-7976. - PMC - PubMed

Publication types

MeSH terms

LinkOut - more resources