. 2005 Jan 19:6:11.
doi: 10.1186/1471-2105-6-11.

Using large-scale perturbations in gene network reconstruction

Affiliations

Using large-scale perturbations in gene network reconstruction

Thomas MacCarthy et al. BMC Bioinformatics. .

Abstract

Background: Recent analysis of the yeast gene network shows that most genes have few inputs, indicating that enumerative gene reconstruction methods are both useful and computationally feasible. A simple enumerative reconstruction method based on a discrete dynamical system model is used to study how microarray experiments involving modulated global perturbations can be designed to obtain reasonably accurate reconstructions. The method is tested on artificial gene networks with biologically realistic in/out degree characteristics.

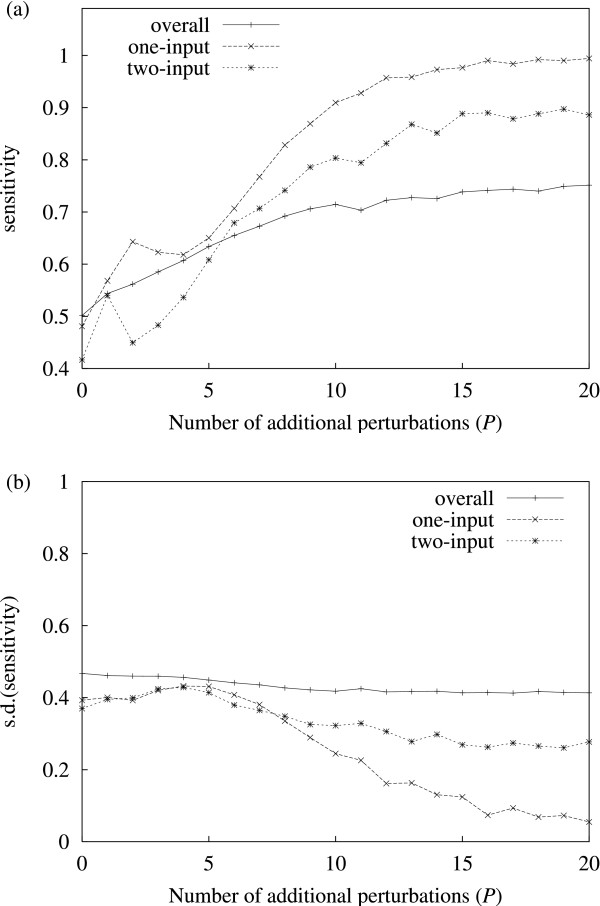
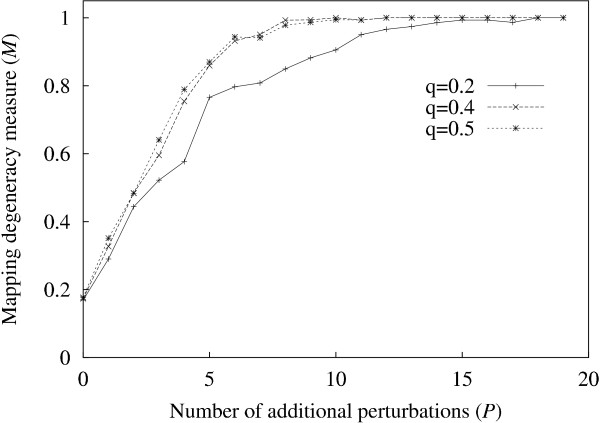
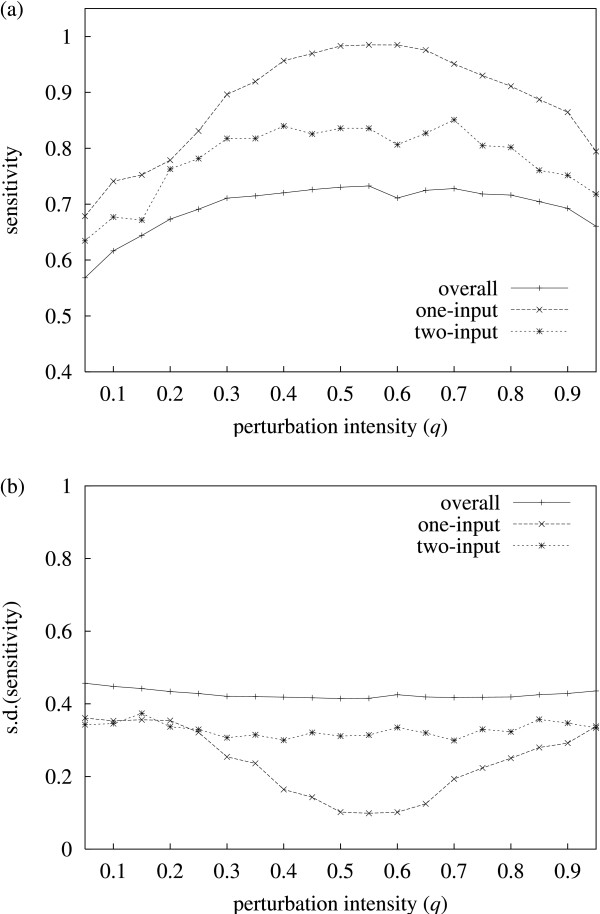
Results: It was found that a relatively small number of perturbations significantly improve inference accuracy, particularly for low-order inputs of one or two genes. The perturbations themselves should alter the expression level of approximately 50-60% of the genes in the network.

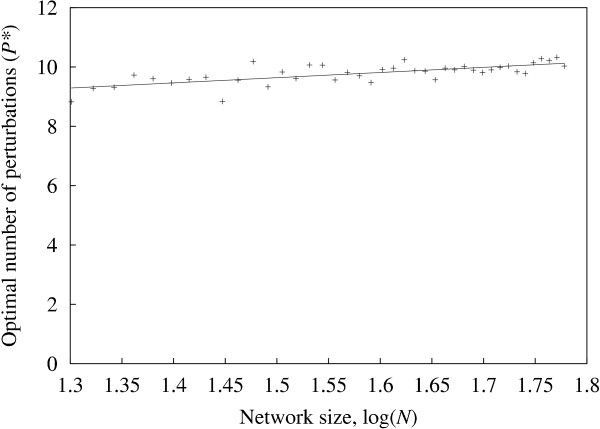
Conclusions: Time-series obtained from perturbations are a common form of expression data. This study illustrates how gene networks can be significantly reconstructed from such time-series while requiring only a relatively small number of calibrated perturbations, even for large networks, thus reducing experimental costs.


Figures

Figure 1
Figure 1
Sensitivity vs. P. (a) Sensitivity vs. number of additional perturbations used. (b) The corresponding standard deviation is shown here separately for clarity. The curves represent results for overall (i.e. all solutions) sensitivity, and specific sensitivity for (predicted) one and two-input solutions. Sensitivity is generally lower for higher order of inputs. Accuracy increases significantly with the number of additional perturbations used. The results shown are average values for 250 random networks at each data point. The remaining parameters are fixed: network size N = 50, perturbation intensity q = 0.5.
Figure 2
Figure 2
M vs. P. M (the number of distinct "concatenated" vectors Si divided by N, the number of genes) increases in value, as the number of perturbations (P) is increased. The graph shows curves for three values of perturbation intensity q.
Figure 3
Figure 3
Perturbations required for high accuracy The minimum number of perturbations (P*) required to reach the high accuracy criterion (average sensitivity = 0.95) for different values of the network size N. Each point represents the average value for 250 random networks inferred. This is equivalent to finding the value of P for which sensitivity = 0.95 on the one-input curve of figure 1(a) for different values of N (figure 1(a) shows N = 50). A linear fit is also shown.
Figure 4
Figure 4
Sensitivity vs. q. (a) Average inference sensitivity vs. perturbation intensity q. (b) The variance (one standard deviation) is shown here separately for clarity. The results show sensitivity for (predicted) one and two-input solutions being generally higher than the overall case. The results shown are average values for 250 random networks inferred. The remaining parameters are fixed: network size N = 50 and P = 12.
Figure 5
Figure 5
Example network. Example of an artificial gene network with N = 50. Positive interactions are shown in black, negative interactions in grey. Note the autoregulatory interaction on the upper right hand side. This diagram was generated using Pajek .

References

    1. Cho R, Campbell M, Winzeler E, Steinmetz L, Conway A, Wodicka L, Wolfsberg T, Gabrielian A, Landsman D, Lockhart D, Davis R. A genome-wide transcriptional analysis of the mitotic cell cycle. Mol Cell. 1998;2:65–73. doi: 10.1016/S1097-2765(00)80114-8. - DOI - PubMed
    1. Spellman P, Sherlock G, Zhang M, Iyer V, Anders K, Eisen M, Brown P, Botstein D, Futcher B. Comprehensive identification of cell cycle-regulated genes of the yeast Saccharomyces cerevisiae by microarray hybridization. Mol Biol Cell. 1998;9:3273–3297. - PMC - PubMed
    1. Tegner J, Yeung M, Hasty J, Collins J. Reverse engineering gene networks: integrating genetic perturbations with dynamical modeling. Proc Natl Acad Sci U S A. 2003;100:5944–5949. doi: 10.1073/pnas.0933416100. - DOI - PMC - PubMed
    1. Gardner T, di Bernardo D, Lorenz D, Collins J. Inferring genetic networks and identifying compound mode of action via expression profiling. Science. 2003;301:102–105. doi: 10.1126/science.1081900. - DOI - PubMed
    1. Tringe S, Wagner A, Ruby S. Enriching for direct regulatory targets in perturbed gene-expression profiles. Genome Biol. 2004;5:60. doi: 10.1186/gb-2004-5-4-r29. - DOI - PMC - PubMed

Publication types

MeSH terms

Substances

LinkOut - more resources