Mapping protein energy landscapes with amide hydrogen exchange and mass spectrometry: I. A generalized model for a two-state protein and comparison with experiment
- PMID: 15659380
- PMCID: PMC2253406
- DOI: 10.1110/ps.041001705
Mapping protein energy landscapes with amide hydrogen exchange and mass spectrometry: I. A generalized model for a two-state protein and comparison with experiment
Abstract
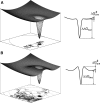
Protein amide hydrogen exchange (HDX) is a convoluted process, whose kinetics is determined by both dynamics of the protein and the intrinsic exchange rate of labile hydrogen atoms fully exposed to solvent. Both processes are influenced by a variety of intrinsic and extrinsic factors. A mathematical formalism initially developed to rationalize exchange kinetics of individual amide hydrogen atoms is now often used to interpret global exchange kinetics (e.g., as measured in HDX MS experiments). One particularly important advantage of HDX MS is direct visualization of various protein states by observing distinct protein ion populations with different levels of isotope labeling under conditions favoring correlated exchange (the so-called EX1 exchange mechanism). However, mildly denaturing conditions often lead to a situation where the overall HDX kinetics cannot be clearly classified as either EX1 or EX2. The goal of this work is to develop a framework for a generalized exchange model that takes into account multiple processes leading to amide hydrogen exchange, and does not require that the exchange proceed strictly via EX1 or EX2 kinetics. To achieve this goal, we use a probabilistic approach that assigns a transition probability and a residual protection to each equilibrium state of the protein. When applied to a small protein chymotrypsin inhibitor 2, the algorithm allows complex HDX patterns observed experimentally to be modeled with remarkably good fidelity. On the basis of the model we are now in a position to begin to extract quantitative dynamic information from convoluted exchange kinetics.
Figures


Similar articles
-
Conformational dynamics of partially denatured myoglobin studied by time-resolved electrospray mass spectrometry with online hydrogen-deuterium exchange.Biochemistry. 2003 May 20;42(19):5896-905. doi: 10.1021/bi034285e. Biochemistry. 2003. PMID: 12741848
-
Measuring the hydrogen/deuterium exchange of proteins at high spatial resolution by mass spectrometry: overcoming gas-phase hydrogen/deuterium scrambling.Acc Chem Res. 2014 Oct 21;47(10):3018-27. doi: 10.1021/ar500194w. Epub 2014 Aug 29. Acc Chem Res. 2014. PMID: 25171396 Review.
-
Hydrogen exchange kinetics of proteins in denaturants: a generalized two-process model.J Mol Biol. 1999 Feb 19;286(2):607-16. doi: 10.1006/jmbi.1998.2484. J Mol Biol. 1999. PMID: 9973574
-
Mapping Protein-Ligand Interactions with Proteolytic Fragmentation, Hydrogen/Deuterium Exchange-Mass Spectrometry.Methods Enzymol. 2016;566:357-404. doi: 10.1016/bs.mie.2015.08.010. Epub 2015 Oct 23. Methods Enzymol. 2016. PMID: 26791987
-
Type 1 and Type 2 scenarios in hydrogen exchange mass spectrometry studies on protein-ligand complexes.Analyst. 2014 Dec 7;139(23):6078-87. doi: 10.1039/c4an01307g. Analyst. 2014. PMID: 25319399 Review.
Cited by
-
Perturbations at the chloride site during the photosynthetic oxygen-evolving cycle.Photosynth Res. 2007 Jun;92(3):345-56. doi: 10.1007/s11120-007-9147-3. Epub 2007 Mar 21. Photosynth Res. 2007. PMID: 17375370
-
Irreversible thermal denaturation of cytochrome C studied by electrospray mass spectrometry.J Am Soc Mass Spectrom. 2009 May;20(5):819-28. doi: 10.1016/j.jasms.2008.12.016. Epub 2008 Dec 31. J Am Soc Mass Spectrom. 2009. PMID: 19200750
-
Non-canonical Shedding of TNFα by SPPL2a Is Determined by the Conformational Flexibility of Its Transmembrane Helix.iScience. 2020 Nov 5;23(12):101775. doi: 10.1016/j.isci.2020.101775. eCollection 2020 Dec 18. iScience. 2020. PMID: 33294784 Free PMC article.
-
Continuous and pulsed hydrogen-deuterium exchange and mass spectrometry characterize CsgE oligomerization.Biochemistry. 2015 Oct 27;54(42):6475-81. doi: 10.1021/acs.biochem.5b00871. Epub 2015 Oct 14. Biochemistry. 2015. PMID: 26418947 Free PMC article.
-
Uncovering protein conformational dynamics within two-component viral biomolecular condensates.Protein Sci. 2025 Jul;34(7):e70181. doi: 10.1002/pro.70181. Protein Sci. 2025. PMID: 40521608 Free PMC article.
References
-
- Arrington, C.B. and Robertson, A.D. 2000. Correlated motions in native proteins from MS analysis of NH exchange: Evidence for a manifold of unfolding reactions in ovomucoid third domain. J. Mol. Biol. 300 221–232. - PubMed
-
- Arrington, C.B., Teesch, L.M., and Robertson, A.D. 1999. Defining protein ensembles with native-state NH exchange: Kinetics of interconversion and cooperative units from combined NMR and MS analysis. J. Mol. Biol. 285 1265–1275. - PubMed
-
- ———. 1994. Protein stability parameters measured by hydrogen exchange. Proteins 20 4–14. - PubMed
-
- Dempsey, C.E. 2001. Hydrogen exchange in peptides and proteins using NMR-spectroscopy. Progr. Nucl. Magn. Reson. Spectrosc. 39 135–170.
Publication types
MeSH terms
Substances
Grants and funding
LinkOut - more resources
Full Text Sources

