. 2005 Feb 1;102(5):1572-7.
doi: 10.1073/pnas.0408709102. Epub 2005 Jan 19.

The landscape of genetic complexity across 5,700 gene expression traits in yeast

Affiliations

The landscape of genetic complexity across 5,700 gene expression traits in yeast

Rachel B Brem et al. Proc Natl Acad Sci U S A. .

Abstract

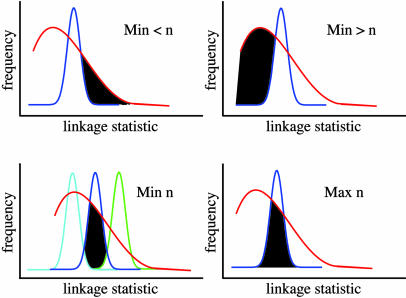
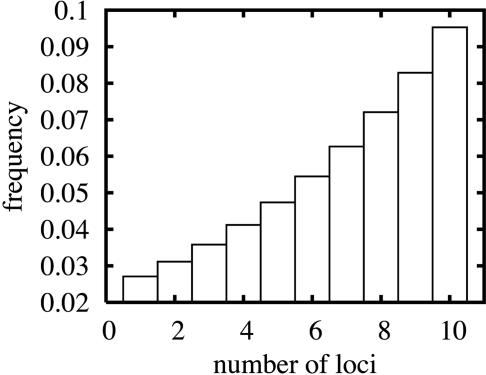
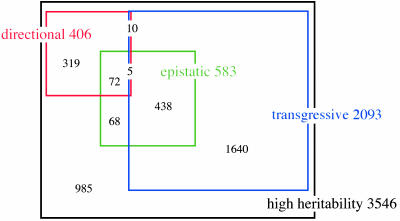
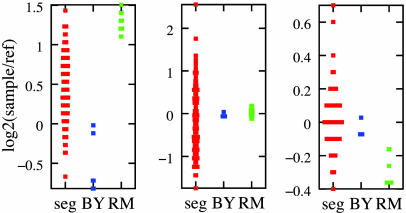
Many studies have identified quantitative trait loci (QTLs) that contribute to continuous variation in heritable traits of interest. However, general principles regarding the distribution of QTL numbers, effect sizes, and combined effects of multiple QTLs remain to be elucidated. Here, we characterize complex genetics underlying inheritance of thousands of transcript levels in a cross between two strains of Saccharomyces cerevisiae. Most detected QTLs have weak effects, with a median variance explained of 27% for highly heritable transcripts. Despite the high statistical power of the study, no QTLs were detected for 40% of highly heritable transcripts, indicating extensive genetic complexity. Modeling of QTL detection showed that only 3% of highly heritable transcripts are consistent with single-locus inheritance, 17-18% are consistent with control by one or two loci, and half require more than five loci under additive models. Strikingly, analysis of parent and progeny trait distributions showed that a majority of transcripts exhibit transgressive segregation. Sixteen percent of highly heritable transcripts exhibit evidence of interacting loci. Our results will aid design of future QTL mapping studies and may shed light on the evolution of quantitative traits.


Figures

Fig. 1.
Fig. 1.
Cartoon illustrating the calculation of bounds on complexity. Each curve represents the results of linkage mapping on many highly heritable transcripts. The x axis represents, for a given transcript, the most significant linkage statistic across all loci tested; statistics are ordered by increasing significance. The y axis shows the proportion of transcripts with a given linkage statistic. In each panel, the red curve represents observed data and the blue curve indicates a simulation of transcripts controlled by n additive QTLs of equal effect. (Upper Left) Black shading represents the minimum proportion of real transcripts less complex than the n-locus model. (Upper Right) Black shading represents the minimum proportion of real transcripts more complex than the n-locus model. (Lower Left) Cyan and green curves represent results from simulations of transcripts controlled by n + 1 and n - 1 additive QTLs of equal effect, respectively; black shading represents the proportion of real transcripts consistent with the n-locus model and no other. (Lower Right) Black shading represents the maximum proportion of real transcripts consistent with the n-locus model.
Fig. 2.
Fig. 2.
Distribution of inheritance patterns in best-fit additive model. Each bar represents an inheritance pattern involving additive loci of equal effect. Bar heights give the proportion of highly heritable transcripts predicted to have each type of inheritance under the fitted geometric model.
Fig. 3.
Fig. 3.
Prevalence of different inheritance patterns among highly heritable transcripts. The black rectangle represents all transcripts with high heritability. Colored squares and numbers represent the transcripts with high heritability that pass the indicated tests for inheritance patterns. Black numbers in overlapping squares represent transcripts that pass multiple tests; the black number at the lower left represents highly heritable transcripts that do not pass any of the tests.
Fig. 4.
Fig. 4.
Expression of genes with strongest evidence for directional, transgressive, and epistatic genetics. In each panel, the first column shows data from 112 segregants and the second and third columns show replicate measurements in the BY and RM parents, respectively. (Left) The cytochrome c reductase subunit YPR191W/QCR2, the annotated gene giving the most significant statistic in the test for directional genetics. (Center) The histidine and purine biosynthetic enzyme YMR120C/ADE17, which gave the most significant statistic in the test for transgressive segregation. (Right) The transcriptional regulator YML051W/GAL80, the annotated gene that gave the most significant statistic in the test for epistasis.

Similar articles

Cited by

References

    1. Lynch, M. & Walsh, B. (1998) Genetics and Analysis of Quantitative Traits (Sinauer, Sunderland, MA).
    1. Flint, J. & Mott, R. (2001) Nat. Rev. Genet. 2, 437-445. - PubMed
    1. Paran, I. & Zamir, D. (2003) Trends Genet. 19, 303-306. - PubMed
    1. Glazier, A. M., Nadeau, J. H. & Aitman, T. J. (2002) Science 298, 2345-2349. - PubMed
    1. Laitinen, T., Polvi, A., Rydman, P., Vendelin, J., Pulkkinen, V., Salmikangas, P., Makela, S., Rehn, M., Pirskanen, A., Rautanen, A., et al. (2004) Science 304, 300-304. - PubMed

Publication types

MeSH terms

Associated data