. 2005 Jan 19;25(3):584-93.
doi: 10.1523/JNEUROSCI.3797-04.2005.

Membrane receptors involved in modulation of responses of spinal dorsal horn interneurons evoked by feline group II muscle afferents

Affiliations

Membrane receptors involved in modulation of responses of spinal dorsal horn interneurons evoked by feline group II muscle afferents

Kimberly J Dougherty et al. J Neurosci. .

Abstract

Modulatory actions of a metabotropic 5-HT1A&7 membrane receptor agonist and antagonist [(+/-)-8-hydroxy-2-(di-n-propylamino)-tetralin; N-[2-[4-(2-methoxyphenyl)-1-piperazinyl]ethyl]-N-(2-pyridinyl) cyclohexane-carboxamide] and an ionotropic 5-HT3 membrane receptor agonist and antagonist [2-methyl-serotonin (2-Me 5-HT); N-(1-azabicyclo[2.2.2]oct-3-yl)-6-chloro-4-methyl-3-oxo-3,4-dihydro-2H-1,4-benzoxazine-8-carboxamide hydrochloride] were investigated on dorsal horn interneurons mediating reflex actions of group II muscle afferents. All drugs were applied ionophoretically in deeply anesthetized cats. Effects of agonists were tested on extracellularly recorded responses of individual interneurons evoked by electrical stimulation of group II afferents in a muscle nerve. Effects of antagonists were tested against the depression of these responses after stimulation of raphe nuclei. The results show that both 5-HT1A&7 and 5-HT3 membrane receptors are involved in counteracting the activation of dorsal horn interneurons by group II afferents. Because only quantitative differences were found within the sample of the tested neurons, these results suggest that modulatory actions of 5-HT on excitatory and inhibitory interneurons might be similar. The relationship between 5-HT axons and axons immunoreactive for the 5-HT3A receptor subunit, which contact dorsal horn interneurons, was analyzed using immunofluorescence and confocal microscopy. Contacts from both types of axons were found on all interneurons, but their distribution and density varied, and there was no obvious relationship between them. In two of six interneurons, 5-HT3A-immunoreactive axons formed ring-like arrangements around the cell bodies. In previous studies, axons possessing 5-HT3 receptors were found to be excitatory, and as 2-Me 5-HT depressed transmission to dorsal horn interneurons, the results indicate that 5-HT operates at 5-HT3 receptors presynaptic to these neurons to depress excitatory transmission.


Figures

Figure 1.
Figure 1.
Diagram of disynaptic and trisynaptic pathways between group II muscle afferents and contralateral motoneurons and the medullary stimulation sites. A, Diagram of connections between dorsal horn interneurons (DH), lamina VIII commissural interneurons (VIII), and contralateral motoneurons (co MN), modified from the study by Edgley et al. (; their Fig.1). For the sake of simplicity, both the excitatory and inhibitory interneurons (Maxwell et al., 1997) are represented by the two interneurons in the diagram. The arrows indicate sites of modulatory serotonergic actions investigated in a previous study (Hammar et al., 2004), which were further analyzed in the present series of experiments. B, Stimulation sites in five experiments; these are superimposed on a scanned image of a transverse section of the medulla at a level corresponding to the caudal border of the superior olive (SO) in the plane of the insertion of the electrodes. agon., Agonist; antagon., antagonist; MLF, medial longitudinal fascicle; Pyr, pyramid; TB, trapezoid body.
Figure 2.
Figure 2.
Depression of field potentials elicited by stimulation of Q or Sart nerves (at the indicated intensities) after ionophoresis or raphe stimulation. In A-D, control field potentials (black) and the depressed field potentials (gray) are superimposed; the lowermost records are from cord dorsum at the L5 level. A, Effects of 8-OH DPAT (1 min). B, Effects of 2-Me 5-HT (1.5 min). C, Effects of 5-HT (2 min). D, Effects of raphe stimulation (100 μA). The depression of the areas of the early components of these field potentials (between the two vertical dotted lines) was to 48, 38, 51, and 23% of the control. In E-G, the pairs of records are of control field potentials (black) and of potentials after stimulation within a raphe nucleus and of the medial longitudinal fascicle 3 mm more dorsal in the same electrode track accompanied by records from the surface of the lateral funiculus at a thoracic (Th) level. MLF, Medial longitudinal fascicle.
Figure 3.
Figure 3.
Effects of 8-OH DPAT. A, Time course of the effects of 8-OH DPAT. Ordinate: means and SEM of the numbers of responses evoked by 20 stimuli are shown. Abscissa: periods of measurements, before and after placement of the drug-containing pipette, during 1.5-3 min of ionophoresis and during 5-20 min of recovery. The plots are based on measurements from 17 sequences of stimuli on responses of all 10 dorsal horn interneurons investigated, seven of which were activated by stimulation of two nerves (Q and Sart or Q and DP, alternating every 15 s). In the cases in which all spikes were abolished before 3 min (n = 8), data points were interpolated (left at 0) until electrode withdrawal. The gray area indicates the duration of the ionophoresis. All data from 1 min 8-OH DPAT on (including recovery) were significantly different from placement (p < 0.05 for 1 min 8-OH DPAT and 20 min recovery; p < 0.001 for the rest). B, Means and SEM of the numbers of responses during two preliminary measurements, before (control) and after (placement) placement of the drug-containing pipette, and means of the maximal depression during ionophoresis (max drug) and after 20-25 min of recovery (max recovery) in individual interneurons. C, Examples of responses of a dorsal horn neuron. The records are as follows (from top to bottom): extracellularly recorded spike potentials of the neuron to a single stimulus; peristimulus time histograms of responses evoked by 20 stimuli before, during, and after 8-OH DPAT iontophoresis; and a record of the afferent volley. The horizontal dotted line indicates the discrimination level for construction of peristimulus time histograms. The vertical dotted lines indicate the onset of the afferent volley and the beginning and the end of the 1.3-ms-long time window within which the peristimulus time histograms were compared. D, Time course of changes in responses of the interneuron illustrated in C. Ordinate: number of spikes within the indicated time window. Abscissa: periods of measurements.
Figure 4.
Figure 4.
Effects of 2-Me 5-HT. A, B, Time course and mean depression evoked by 2-Me 5-HT as in Figure 3, A and B. The plots are based on measurements from 15 sequences of stimuli on responses of 11 dorsal horn interneurons, four of which were activated by stimulation of both Q and Sart nerves. When spikes were abolished before 3 min (n = 5), data points for the remaining period before the onset of the recovery were interpolated (taken as 0). All data from current on (p < 0.05) and after [p < 0.01 for 30 s (and 15 min recovery), and p < 0.001 for the rest], with the exception of 20 min recovery, were significantly different from placement. C, D, Data for one of the interneurons with the same format as in Figure 3, C and D.
Figure 5.
Figure 5.
Examples of the effects of 5-HT1A and 5-HT3 receptor antagonists on the depression of activity of dorsal horn interneurons from raphe nuclei. Records from two interneurons (A-C and D-F) in two experiments are shown. A, D, Top traces, Extracellular records after stimulation of the Sart nerve. Dotted lines indicate the discrimination level for construction of peristimulus time histograms and cumulative sums. Bottom traces, Parallel records from the cord dorsum at a lumbar level. B, E, As in A and D but when the Sart nerve stimulation was preceded by raphe stimulation leading to the disappearance of responses of the interneurons or to a lower probability of their activation. C, F, Cumulative sums of responses evoked by 20 stimuli, each response lifting the curve by one step in real time (with the calibration at the bottom in C). Black, Responses evoked by group II afferents in the absence of raphe stimuli (test control, corresponding to A and D). Gray, Reduced number of responses evoked when raphe stimuli preceded stimulation of group II afferents (corresponding to B and E) before (conditioned control) and during ionophoresis of the antagonists (after the indicated periods of ionophoresis).
Figure 6.
Figure 6.
The degree and time course of disinhibition evoked by 5-HT1A and 5-HT3 receptor antagonists. Mean disinhibition, time course, and test response in the presence of WAY 100635 (A-C), Y-25130 (D-F), and bicuculline (G-I) are shown. A, Mean depression and SEM of the response to nerve stimulation when preceded by raphe stimulation (conditioned response), shown as a percentage of the response to nerve stimulation alone (test) during control, placement of drug containing pipette (placem.), maximal effect during ionophoresis (max drug), and after 20-30 min of recovery (max recovery) for the nine cells in which WAY 100635 consistently reversed the depression (gray) and all 22 cells in which WAY 100635 was tested (white). B, Time course of the effects of WAY 100635. Ordinate: mean-conditioned response to 20 stimuli shown as a percentage of test response. Abscissa: time points of measurements before and after placement of drug-containing pipette during ionophoresis and recovery. The means are based on the nine responses in which the most clear-cut reversal of the raphe depression was seen (A, gray). The shaded area represents the duration of ionophoresis. WAY 100635 significantly (p < 0.05) counteracted the depression from 9 min through withdrawal of the drug-containing pipette. C, Responses evoked by 20 test stimuli were not affected by WAY 100635 application. D-F, Effects of Y-25130 shown in the same format as A-C. Mean depressions (D) are shown for control, placement, maximum drug, and maximum recovery for the six cells in which Y-25130 reversed the depression (gray) and in all 17 cells in which Y-25130 was tested (white). The effects of Y-25130 were significantly different from placement (p < 0.05) from 3 to 4 min and 6 min ionophoresis through 10 min recovery. G-I, Effects of bicuculline are shown in the same format as in A-C. Mean conditioned responses (G) are for four cells in which bicuculline had an effect (gray) and all nine cells tested with bicuculline (white): control, placement, maximum drug, and maximum recovery. Conditioned responses (H) exceeded test responses in the presence of bicuculline, as seen by responses exceeding 100%. The test response (I) decreased during bicuculline application.
Figure 7.
Figure 7.
Examples of records from the intracellularly labeled dorsal horn interneurons. In all panels, top records are from the interneurons, and bottom records are from the cord dorsum. 1/1-5/1, EPSPs recorded in interneurons listed in Table 1 (in cats 1-5). They were evoked by stimulation of either the quadriceps (Q) or sartorius (Sart) nerves at five times threshold for a given nerve, as indicated at the left. The dotted lines indicate the time of arrival of afferent volleys in group I afferents, the estimated time of arrival of afferent volleys in group II afferents (delayed by 0.7-0.8 ms), and latencies of the earliest EPSPs. It will be noted that both the shortest (monosynaptic) and longer (monosynaptic or disynaptic) latency EPSPs (with their latencies indicated to the left) were followed by some later EPSPs or IPSPs.
Figure 8.
Figure 8.
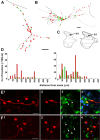
Distribution of 5-HT-immunoreactive axons and terminals immunoreactive for 5-HT3A receptor subunits in close apposition to dorsal horn interneurons. A, B, Reconstructions of cells 4/1 (A) and 3/1 (B); contacts formed by 5-HT axons are indicated in red, and contacts from 5-HT3-immunoreactive axons are indicated in green. The thicker gray lines demarcate the border of the gray matter. Scale bars, 50 μm. C, Positions of labeled cell bodies in the dorsal horn. Cell 5/1 was obtained from an experiment in which the tissue was sectioned in the sagittal plane and is not shown on the diagram but was situated dorsal to the reticulated area of lamina V. D, Sholl plots illustrating the distribution of 5-HT- and 5-HT3-immunoreactive varicosities on the dendritic trees (cell 4/1, left; 3/1, right). E, Series of confocal microscope images demonstrating that terminals from cell 4/1 are immunopositive for VGLUT2. 1, Projected images (red); 2-4, single optical sections of axonal swellings showing VGLUT2 (blue) and GAD (green) immunostaining. F, Series of confocal microscope images showing that terminals from cell 3/1 are closely apposed to labeling for the glycine receptor-associated protein, gephyrin. 1, Projected image showing a cluster of four boutons (red); 2-4, single optical sections showing immunoreactivity for VGLUT1 (blue) and gephyrin (green) and a merged image, respectively. Arrowheads indicate gephyrin-immunoreactive puncta that are associated with axonal swellings. Scale bars, 5 μm.
Figure 9.
Figure 9.
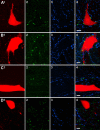
Clustering of terminals immunoreactive for 5-HT3A receptor subunits around somata of dorsal horn interneurons. A series of single optical sections of four neurons (A, cell 1/1; B, cell 1/2; C, cell 5/1; D, cell 2/1) show that two of these (A, B) had contacts from both types of immunolabeled axons clustered around the somata. Two additional cells from the sample (C, D) show no such arrangements, although immunoreactive axons are present in the surrounding tissue. 1, Sections through labeled cells (red); 2, 3, immunolabeling for 5-HT3A receptor subunits (green) and 5-HT (blue); 4, merged images. Scale bars, 10 μm.

Similar articles

Cited by

References

    1. Abhold RH, Bowker RM (1990) Descending modulation of dorsal horn biogenic amines as determined by in vivo dialysis. Neurosci Lett 108: 231-236. - PubMed
    1. Aggelopoulos NC, Burton MJ, Clarke RW, Edgley SA (1996) Characterization of a descending system that enables crossed group II inhibitory reflex pathways in the cat spinal cord. J Neurosci 16: 723-729. - PMC - PubMed
    1. Alexander SP, Mathie A, Peters JA (2004) Guide to receptors and channels. Br J Pharmacol 141[Suppl 1]: S1-S126. - PMC - PubMed
    1. Alstermark B, Kummel H, Tantisira B (1987) Monosynaptic raphespinal and reticulospinal projection to forelimb motoneurones in cats. Neurosci Lett 74: 286-290. - PubMed
    1. Bannatyne BA, Edgley SA, Hammar I, Jankowska E, Maxwell DJ (2003) Networks of inhibitory and excitatory commissural interneurons mediating crossed reticulospinal actions identified by immunocytochemistry. Eur J Neurosci 18: 2273-2284. - PMC - PubMed

Publication types

MeSH terms

LinkOut - more resources