. 2005 Jan 19;25(3):604-13.
doi: 10.1523/JNEUROSCI.4151-04.2005.

Responses of human anterior cingulate cortex microdomains to error detection, conflict monitoring, stimulus-response mapping, familiarity, and orienting

Affiliations

Responses of human anterior cingulate cortex microdomains to error detection, conflict monitoring, stimulus-response mapping, familiarity, and orienting

Chunmao Wang et al. J Neurosci. .

Abstract

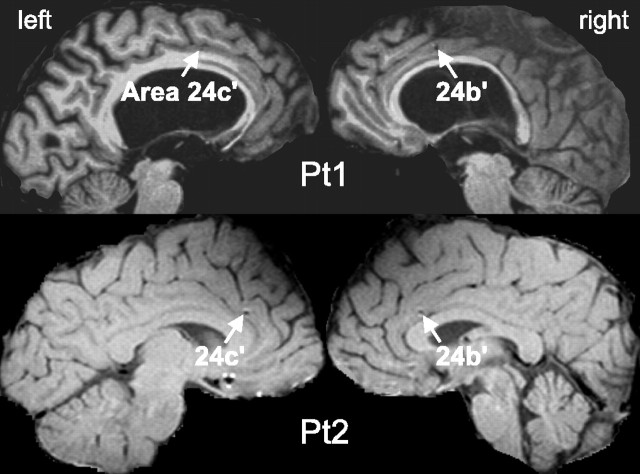
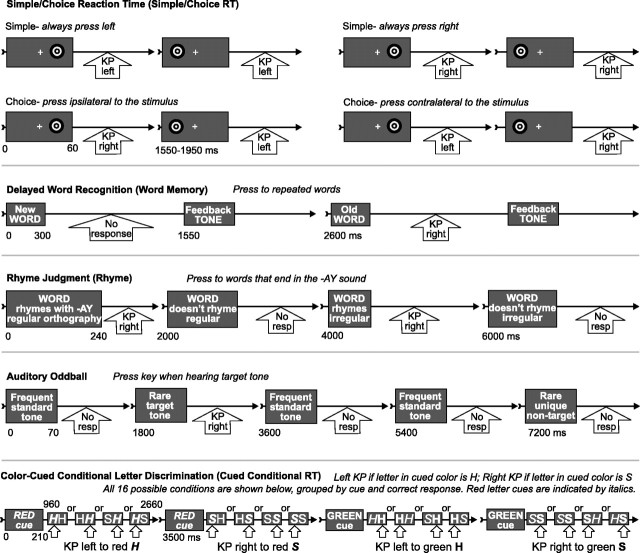
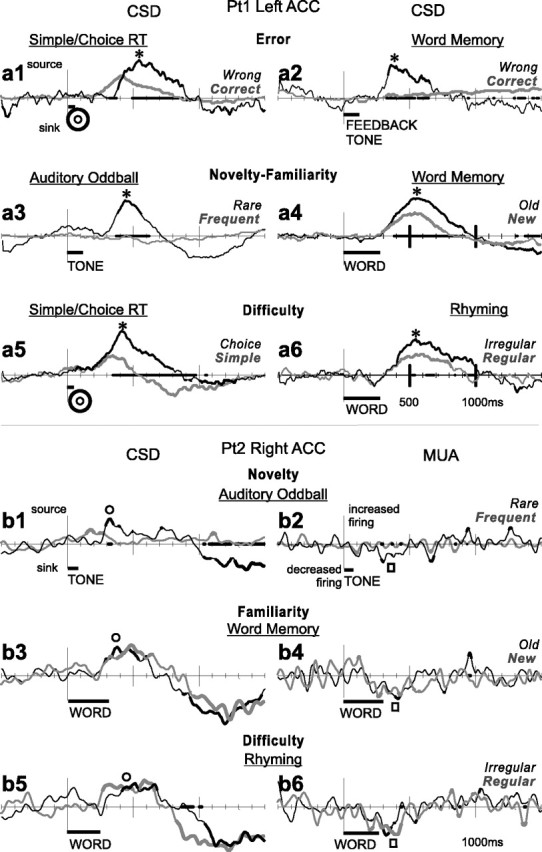
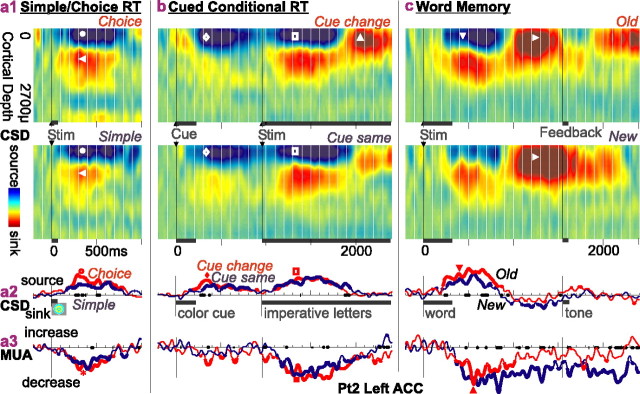
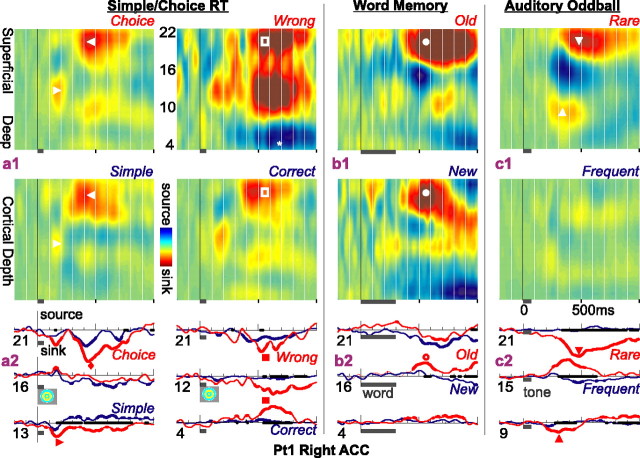
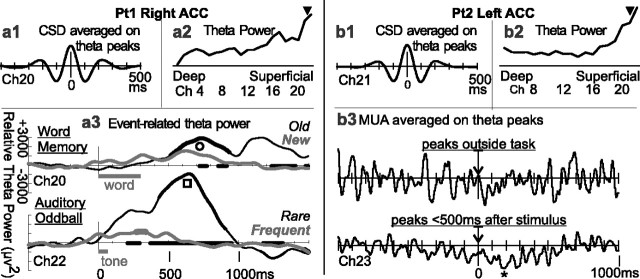
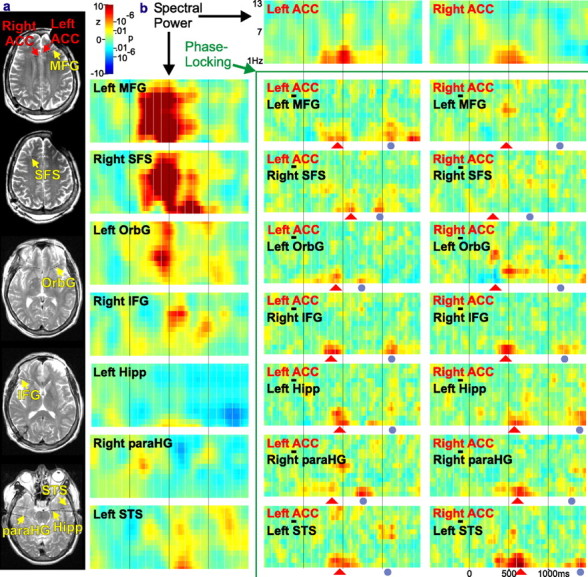
Human anterior cingulate cortex (ACC) activity modulation has been observed in numerous tasks, consistent with a wide variety of functions. However, previous recordings have not had sufficient spatial resolution to determine whether microdomains (approximately one to two columns) are involved in multiple tasks, how activity is distributed across cortical layers, or indeed whether modulation reflected neuronal excitation, inhibition, or both. In this study, linear arrays of 24 microelectrodes were used to estimate population synaptic currents and neuronal firing in different layers of ACC during simple/choice reaction time, delayed word recognition, rhyming, auditory oddball, and cued conditional letter-discrimination tasks. Responses to all tasks, with differential responses to errors, familiarity, difficulty, and orienting, were recorded in single microdomains. The strongest responses occurred approximately 300-800 ms after stimulus onset and were usually a current source with inhibited firing, strongly suggesting active inhibition in superficial layers during the behavioral response period. This was usually followed by a sink from approximately 800 to 1400 ms, consistent with postresponse rebound activation. Transient phase locking of task-related theta activity in superficial cingulate layers suggested extended interactions with medial and lateral frontal and temporal sites. These data suggest that each anterior cingulate microdomain participates in a multilobar cortical network after behavioral responses in a variety of tasks.


Figures

Figure 1.
Figure 1.
Locations of laminar probes in MRIs taken with the electrodes in situ. Laminar probes are indicated by dark MRI artifacts (arrowheads; artifacts are larger than the actual electrodes). All contacts appear to lie in Brodmann's area 24′ (Vogt et al., 2004). Note the dilation of the third ventricle in Pt1 attributable to compensated aqueductal stenosis.
Figure 2.
Figure 2.
Five cognitive tasks and conditions compared in the present study. Time lines show the sequence of events in typical trials. KP, Key press. Please see Materials and Methods for additional explanation.
Figure 3.
Figure 3.
Possible IPSC indicated by a large CSD source with decreased MUA across multiple tasks. a, CSD waveforms recorded from the left ACC of Pt1. A large current source (*) was evoked from ∼300 to 800 ms in simple/choice RT (a1, a5), word recognition memory (a2, a4), auditory oddball (a3), and rhyming (a6). Source currents were larger after wrong (compared with correct) responses (a1) and after a feedback tone indicating wrong responses (a2), suggesting modulation by errors; to rare than frequent tones (a3) and to old rather than new words (a4), suggesting modulation by novelty-familiarity; to stimuli that required a differential choice response [compared with a constant simple response (a5)]; or an evaluation of irregular orthography [as opposed to regular orthography (a6)], suggesting a relationship to difficulty, perhaps in stimulus-response mapping. b, CSD (left) and simultaneous MUA (right) waveforms recorded from the right ACC of Pt2. Again, a current source (○) was evoked from ∼300 to 700 ms in a variety of tasks involving auditory discrimination (b1), word recognition memory (b3), or rhyming (b5), although differentiation between task conditions is not as clear. Simultaneous MUA recordings show a decrease during these tasks (□) from ∼200 to 500 ms (b2, b4, b6). Task names are underlined; condition names are in italics. Dark gray bars below x-axes indicate stimulus presentation periods. The x-axis is thickened when the two conditions are significantly different from each other; CSD and MUA waveforms are thickened when significantly different from zero (two-tailed p < 0.01).
Figure 4.
Figure 4.
Possible IPSCs in superficial cortical layers across multiple cognitive tasks; Pt2 left ACC. a, CSD and MUA during simple and choice responses to lateralized visual stimuli. a1, Contour plots of CSD over time and cortical depth show sustained superficial sources (blue region with •, where positive current leaves the cell) with deeper sinks (red region with ◂, where positive current enters the cell). a2, The same data are plotted as a waveform from a superficial contact, showing a larger source (○) to choice than simple RT. a3, MUA decreases (*) during the sources shown in a1 and a2, indicating that they are likely IPSCs. b, A cued conditional letter discrimination task evokes again a strong superficial source (⋄) that is slightly larger when the cue is different from the preceding trial (♦). The source evoked by the imperative stimulus (□) is accompanied by decreased MUA (▪) and is followed by a superficial sink (▵). C, A similar pattern of superficial source (▾) followed by a sink (▸) and MUA inhibition (▴) is evoked by words in a memory task, with a larger source to the repeated (old) words. Note that to visualize all of the responses, the vertical scale in the left column has been compressed twofold. Thickening of the CSD and MUA waveforms indicates that they are significantly different from zero; thickening of the x-axis indicates that the two conditions are significantly different from each other (two-tailed p < 0.01).
Figure 5.
Figure 5.
CSD sinks in cognitive tasks. CSD contours (above) and waveforms (below) in the right ACC of Pt1, where, unlike other sites, the CSD was dominated by sinks rather than sources. a1, CSD contours recorded as the subject makes simple and choice responses to lateralized visual stimuli. The earliest response seen in this site is a small sink in middle layers between 100 and 200 ms (▸), followed by a larger sink in superficial layers from ∼350 to 800 ms (◂). The response to choice responses is larger than to simple responses. A larger difference is seen when the trials with incorrect responses are segregated from those with correct responses (□). The deep source (*) may be a passive return current. a2, CSD waveforms from selected channels in the different conditions show the larger sinks to choice (♦) and wrong (▪) trials. b1, A superficial sink (•) is also evoked by words in a declarative memory task from ∼350 to 1000 ms, with a larger response to repeated words. b2, Traces from selected channels again show that differential responses (○) are present in multiple layers of ACC. c1, c2, Current sinks initially in middle layers (▴) then more superficially (▾) from ∼300 to 1000 ms are again prominently evoked, in this case by rare tones. Note that to visualize all of the responses, the vertical scale in the left column has been compressed two times in the second and third columns and four times in the right column. CSD waveforms are thickened when significantly different from zero; the x-axis is thickened when the two conditions are significantly different from each other (two-tailed p < 0.01).
Figure 6.
Figure 6.
Task-related theta rhythm generated in superficial cortical layers of ACC of two patients. a1, b1, When averaged on the peak of the single sweep LFP, the CSD theta showed a period of ∼200 ms in both patients. a2, b2, Theta power (4-7 Hz) was calculated on single-sweep CSD from -512 ms before to 1536 ms after stimulus onset in simple/choice RT. In both patients, theta power was concentrated in superficial cortical layers (▾). a3, Event-related theta power was calculated from individual trial CSD recorded in the superficial layers of the right ACC in Pt1 and then averaged. It showed a strong task-related increase peaking at ∼700 ms after words (○), especially when repeated words, and after tones (▪), especially when infrequent. The x-axis is thickened when the two conditions are significantly different from each other; the waveforms are thickened when significantly different from zero (two-tailed p < 0.01). b3, MUA recorded in the superficial layers of Pt2 left ACC was averaged with respect to peaks of the local theta rhythm. No relationship is apparent during the period between tasks, but a decreased firing is apparent with respect to theta occurring immediately after the stimulus (*).
Figure 7.
Figure 7.
Single trial spectral analysis of ACC interaction with other cortical sites. a, The locations of micro laminar contacts in ACC (labeled in red) and macro contacts in the frontal and temporal lobes (labeled in yellow) seen in MRI obtained with the probes in place. The defect over the left frontal area is an artifact caused by an external connector. IFG, Inferior frontal gyrus; MFG, middle frontal gyrus; SFS, superior frontal sulcus; OrbG, orbital gyrus; Hipp, hippocampus; STS, superior temporal sulcus; paraHG, parahippocampal gyrus. b, Interactions were calculated between micro and macro contacts. Each colored box plots z-scores comparing spectral measures for each frequency (from 1 to 13 Hz; y-axis) and each latency (-500-1500 ms; x-axis) for every trial to those calculated in the baseline period. Spectral power during the rhyme task is plotted in the boxes on the top row and left column; phase locking is plotted in the boxes at bottom right (other tasks gave similar results). Across sites, the most consistent event-related spectral changes were in the theta and gamma bands. Task-related increases in phase locking in these bands between both ACC and multiple frontotemporal sites occurred most reliably between 200 and 700 ms after stimulus onset (indicated by •). A second, less consistent burst of phase locking occurred at ∼1000 ms (indicated by ▴). The correspondence of the z-scores to probabilities in the normal distribution are shown on the scale.

References

    1. Allman JM, Hakeem A, Erwin JM, Nimchinsky E, Hof P (2001) The anterior cingulate cortex. The evolution of an interface between emotion and cognition. Ann NY Acad Sci 935: 107-117. - PubMed
    1. Barbas H (2000) Connections underlying the synthesis of cognition, memory, and emotion in primate prefrontal cortices. Brain Res Bull 52: 319-330. - PubMed
    1. Bastiaansen M, Hagoort P (2003) Event-induced theta responses as a window on the dynamics of memory. Cortex 39: 967-992. - PubMed
    1. Baudena P, Heit G, Clarke JM, Halgren E (1995) Intracerebral potentials to rare target and distractor auditory and visual stimuli: 3. Frontal cortex. Electroencephalogr Clin Neurophysiol 94: 251-264. - PubMed
    1. Bland BH, Oddie SD (1998) Anatomical, electrophysiological and pharmacological studies of ascending brainstem hippocampal synchronizing pathways. Neurosci Biobehav Rev 22: 259-273. - PubMed

Publication types

MeSH terms