. 2005 Jan 19;25(3):652-61.
doi: 10.1523/JNEUROSCI.3036-04.2005.

Ensemble coding of vocal control in birdsong

Affiliations

Ensemble coding of vocal control in birdsong

Anthony Leonardo et al. J Neurosci. .

Abstract

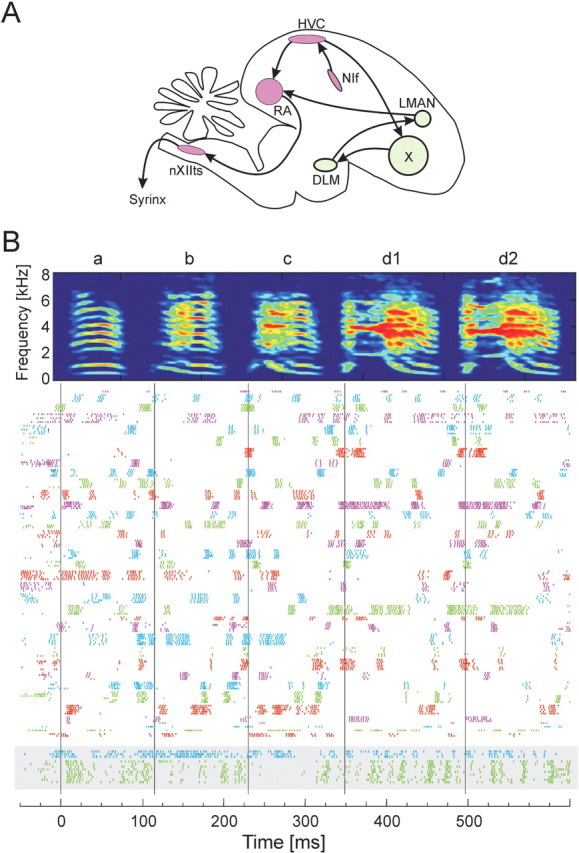
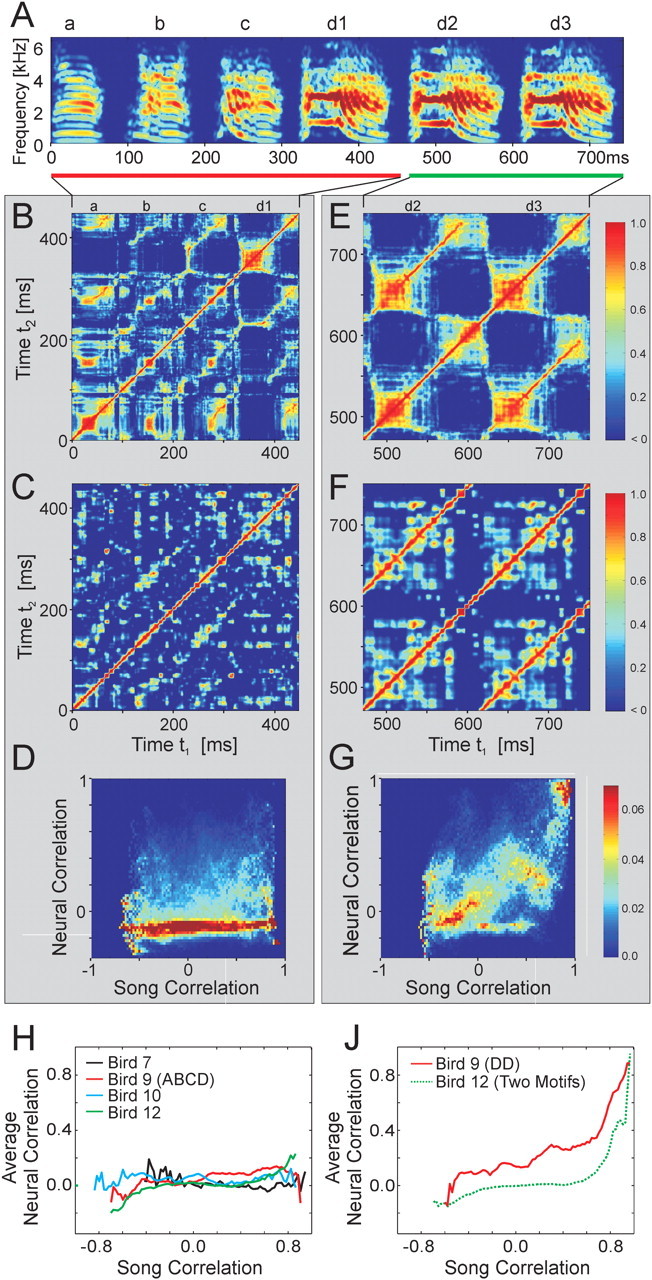
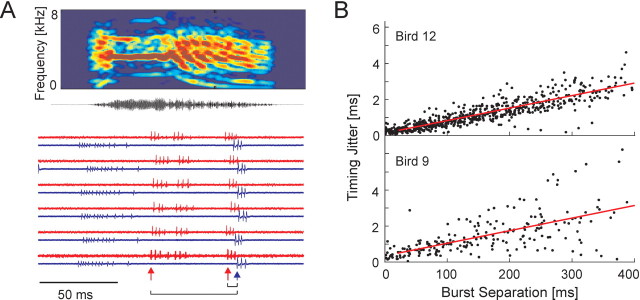
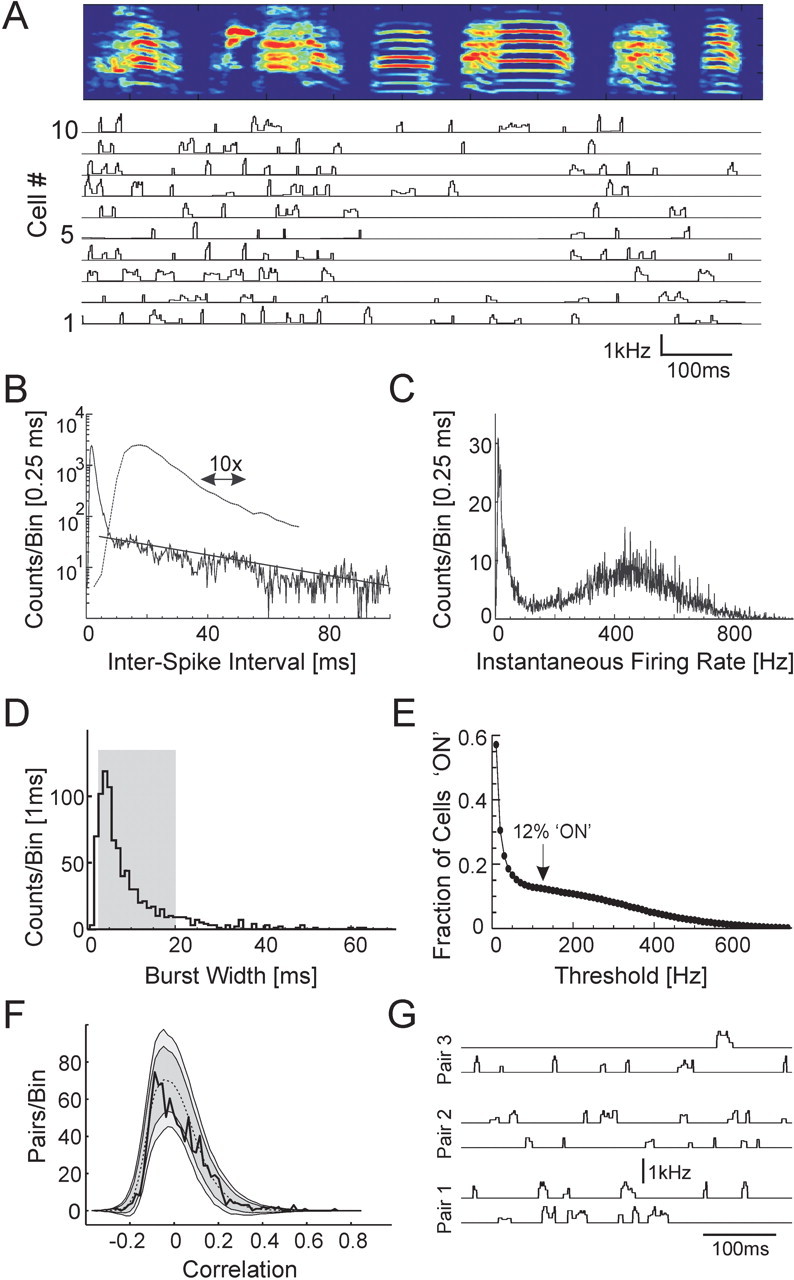
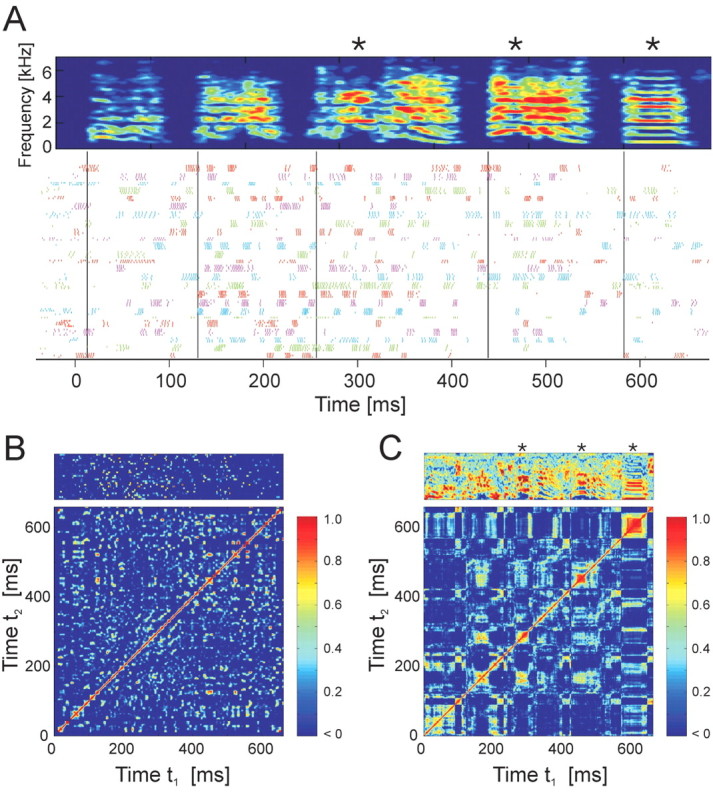
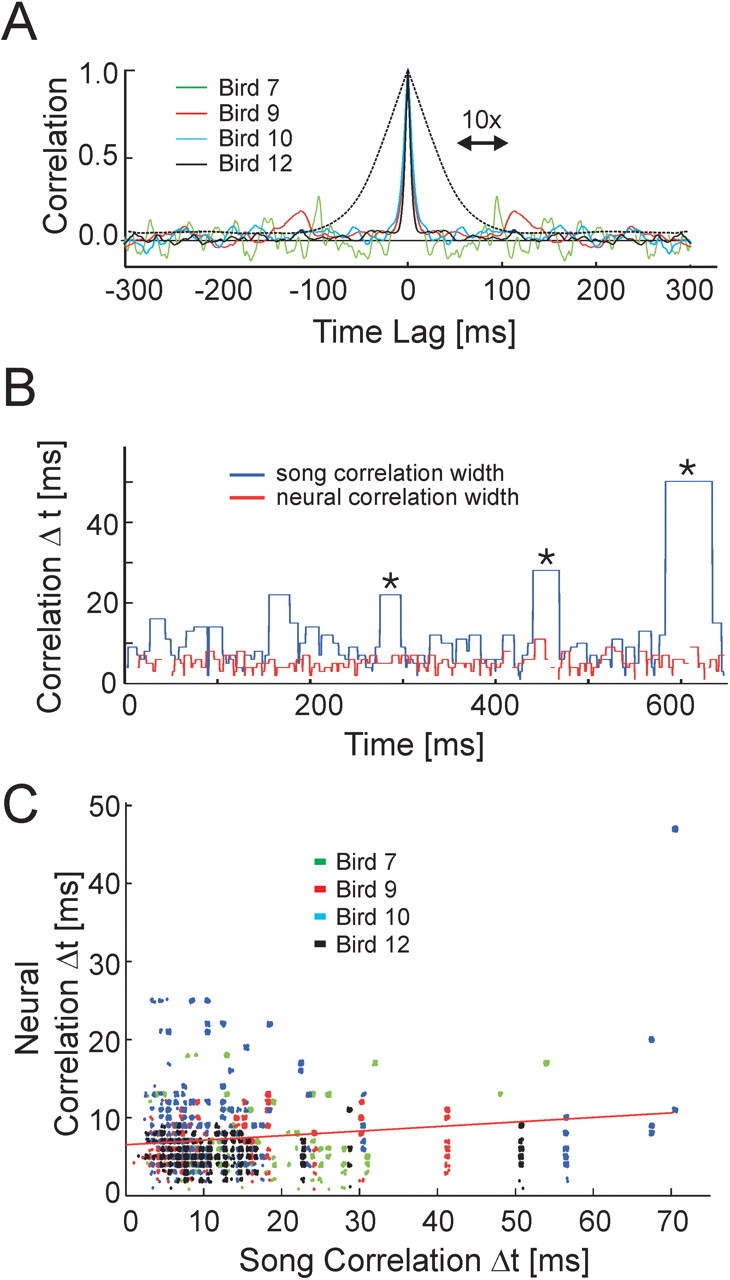
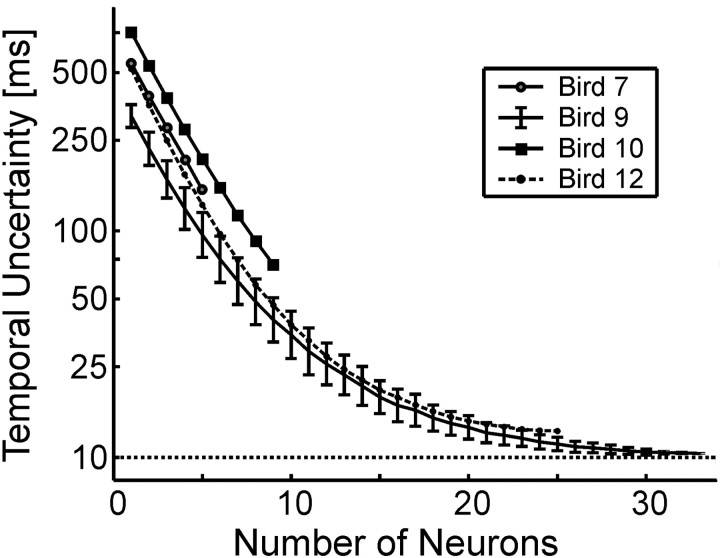
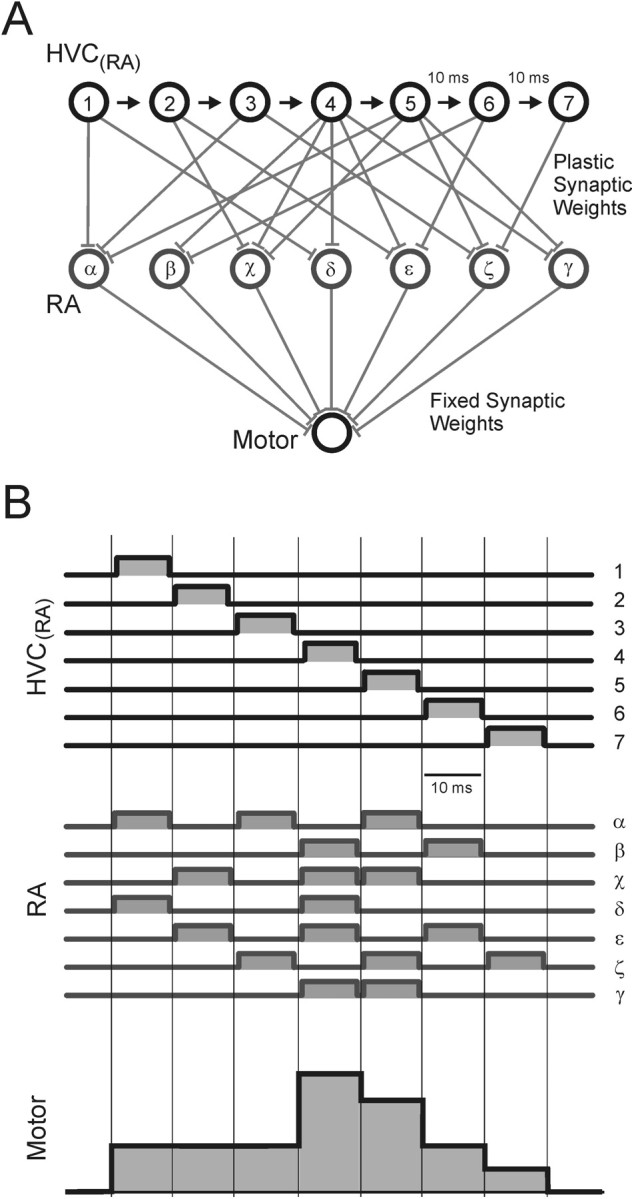
Zebra finch song is represented in the high-level motor control nucleus high vocal center (HVC) (Reiner et al., 2004) as a sparse sequence of spike bursts. In contrast, the vocal organ is driven continuously by smoothly varying muscle control signals. To investigate how the sparse HVC code is transformed into continuous vocal patterns, we recorded in the singing zebra finch from populations of neurons in the robust nucleus of arcopallium (RA), a premotor area intermediate between HVC and the motor neurons. We found that highly similar song elements are typically produced by different RA ensembles. Furthermore, although the song is modulated on a wide range of time scales (10-100 ms), patterns of neural activity in RA change only on a short time scale (5-10 ms). We suggest that song is driven by a dynamic circuit that operates on a single underlying clock, and that the large convergence of RA neurons to vocal control muscles results in a many-to-one mapping of RA activity to song structure. This permits rapidly changing RA ensembles to drive both fast and slow acoustic modulations, thereby transforming the sparse HVC code into a continuous vocal pattern.


Figures

Figure 1.
Figure 1.
Recording of the activity of a large population of RA neurons in the singing zebra finch. A, Simplified schematic view of the oscine song control system. The premotor pathway from HVC to RA to nXIIts (hypoglossal nucleus) to the vocalorgan (syrinx) is highlighted in red. DLM, Medial nucleus of the dorsolateral thalamus; LMAN, lateral magnocellular nucleus of the anterior nidopallium (Reiner et al., 2004); NIf, nucleus interface of the nidopallium. B, Raster plot of song-aligned spike activity of all 34 RA projection neurons recorded during singing in bird 9. Each row shows the spikes produced during one song motif. Different colored spike trains represent the activities of different RA neurons, which have all been aligned to a common time axis using the song motif. Each RA neuron produced a pattern of bursts that was generally different from all other RA neurons. Two putative RA interneurons recorded in the same bird are shown at the bottom (gray box). The time-frequency spectrogram at the top of the figure shows a representative song motif for this bird.
Figure 6.
Figure 6.
Analysis of correlation between patterns of activity in RA and acoustic structure in the song. A, Spectrogram of a song that contains repeated acoustic structure (bird 9). This bird stuttered syllable d a variable number of times (d1, d2, d3...). The song is divided into two sections, one with only repeated syllables (d2, d3; green bar) and another with different syllables that contain regions of similar subsyllables (a, b, c, d1; red bar). B, C, Song correlation matrix and neural correlation matrix for syllables a, b, c, and d1. D, Conditional probability distribution of neural correlations at different levels of song correlation. Each column represents the distribution of neural ensemble correlations associated with the level of song correlation indicated on the x-axis. E-G, Song correlation matrix, neural correlation matrix, and conditional probability distribution of neural correlations for syllables d2 and d3. During repeated syllables, the highly correlated sounds are associated with highly correlated neural ensembles. In contrast, during the production of different syllables with similar subsyllables, the highly correlated sounds are associated with uncorrelated neural ensembles. H, Average neural correlation as a function of song correlation for each bird for the portion of the song motif containing repeated subsyllables but not repeated syllables. J, Average neural correlation as a function of song correlation for repeated syllables d2 and d3 in bird 9 and for repeated song motifs in bird 12.
Figure 3.
Figure 3.
Spike timing precision with in RA. A, Simultaneous recording of three RA neurons shown for six renditions of one song syllable (syllable d, bird 9; see Fig. 1 B). One neuron was recorded on one electrode (top trace of each pair; red); two additional neurons were recorded on another electrode (bottom trace; blue). After the neural signals were aligned to the onset of syllable d, individual bursts were identified, and the time between the onset of each pair of bursts was measured. B, The timing jitter between burst onsets in pairs of neurons as a function of burst separation is shown for all pairs of bursts (n = 1299 burst pairs) in all pairs of simultaneously recorded neurons (n = 13 neuron pairs).
Figure 2.
Figure 2.
Statistics of RA firing patterns. A, Instantaneous firing rates of 10 RA neurons from bird 10 over the course of the song motif. RA neurons exhibit pronounced bursts with rapid onset and offset. At the top is the spectrogram of the bird's song. Note the reduction in RA burst density during the production of simple harmonic syllables versus complex nonharmonic syllables. B, Interspike interval histogram for all song-related RA spike trains (all birds; dashed line is a 10× zoom of the solid line). C, Distribution of instantaneous firing rates (all birds). D, Histogram of burst durations (threshold of 125 Hz; all birds). The mean burst length is 8.67 ms; the gray box marks the 10-90% interval. E, Average fraction of RA bursts with firing rates above threshold, as a function of threshold (all birds). Note the plateau at ∼125 Hz, with a fraction “on” of 12%. F, Distribution of correlations between all pairs of RA neurons recorded in each bird, accumulated across all birds (solid black line, 0.02 bin size; n = 946 pairs). The distribution for simulated data with randomly placed bursts is also shown (mean, dashed black line; ±2 SD, dark gray region; ±3 SD, light gray region). G, Instantaneous firing rate traces for three pairs of neighboring RA neurons in bird 9. Each pair was recorded simultaneously on the same microelectrode.
Figure 4.
Figure 4.
Correlation matrices of the RA population activity and song acoustic structure. A, Raster plot of song-aligned spike activity of 25 RA neurons recorded during singing in bird 12; cycled colors indicate different RA neurons as in Figure 1 B. The asterisks mark three syllables that are tracked in C and in Figure 5. B, Neural correlation matrix for the spike data shown in A. Each point (t1, t2) in the matrix represents the correlation of the pattern of neural activity at time t1 with that at time t2. The vector of neuronal firing rates is shown at the top. C, Song correlation matrix for the spectrogram shown in A. Each point in the matrix represents the correlation of the pattern of sound frequencies shown in the song spectrogram at time t1 with that at time t2. The normalized song spectrogram used in computing the song correlations is shown at the top.
Figure 5.
Figure 5.
Temporal evolution of RA activity patterns and song acoustic structure. A, Autocorrelation of population firing patterns. The neural correlation matrix in Figure 4 B is averaged along its diagonals to estimate typical duration of a neural ensemble. The full-width at half maximum is 7.9 ms; the dashed line shows a 10× zoom of bird 12. B, The time varying width (Δt) of the song and neural correlation matrix diagonals (Fig. 4 B, C) shows that many slowly changing sounds were generated by rapidly changing patterns of RA neural activity. C, Cluster plot of song and neural correlation widths (Δt) pooled across all four birds.
Figure 7.
Figure 7.
Temporal uncertainty in song position as a function of RA sample size. Each pattern of RA activity specifies a temporal position in the song with a resolution that varies with the number of RA neurons in the sample. With ∼30 neurons, one can predict the temporal position in the song with a resolution comparable with the average RA burst width (∼10 ms).
Figure 8.
Figure 8.
Model of song motor control. A, Working hypothesis for the generation of vocal control signals. Each HVC(RA) neuron (1-7) bursts at a single time in the song motif. Each of these HVC neurons drives a different subpopulation of RA neurons (α-γ). Activity in RA is then integrated into continuous muscle control signals by the motor unit. Although only one motor output is shown, the model is easily extended to an arbitrary number of outputs. B, Activity patterns in the song motor control model. Discrete and sparse activity in HVC is converted to discrete and dense activity in RA. At each 10 ms time step in the song, a different population of RA neurons is active. Note that constant vocal outputs can be generated by rapidly evolving patterns of RA activity because of convergence and integration from RA to muscles (time steps 1-3). The end-to-end alignment of burst onsets and offsets is for graphical clarity only; it is not known whether burst patterns in populations of RA or HVC(RA) neurons are organized in this manner.

Similar articles

Cited by

References

    1. Bottjer SW, Miesner EA, Arnold AP (1984) Forebrain lesions disrupt development but not maintenance of song in passerine birds. Science 224: 901-903. - PubMed
    1. Brainard MS, Doupe AJ (2000) Interruption of a basal ganglia-forebrain circuit prevents plasticity of learned vocalizations. Nature 404: 762-766. - PubMed
    1. Canady RA, Burd GD, DeVoogd TJ, Nottebohm F (1988) Effect of testosterone on input received by an identified neuron type of the canary song system: a Golgi/electron microscopy/degeneration study. J Neurosci 8: 3770-3784. - PMC - PubMed
    1. Chi Z, Margoliash D (2001) Temporal precision and temporal drift in brain and behavior of zebra finch song. Neuron 32: 899-910. - PubMed
    1. Fee MS, Leonardo A (2001) Miniature motorized microdrive and commutator system for chronic neural recordings in small animals. J Neurosci Methods 112: 83-94. - PubMed

Publication types

LinkOut - more resources