

Controlling bursting in cortical cultures with closed-loop multi-electrode stimulation
- PMID: 15659605
- PMCID: PMC2663856
- DOI: 10.1523/JNEUROSCI.4209-04.2005
Controlling bursting in cortical cultures with closed-loop multi-electrode stimulation
Abstract
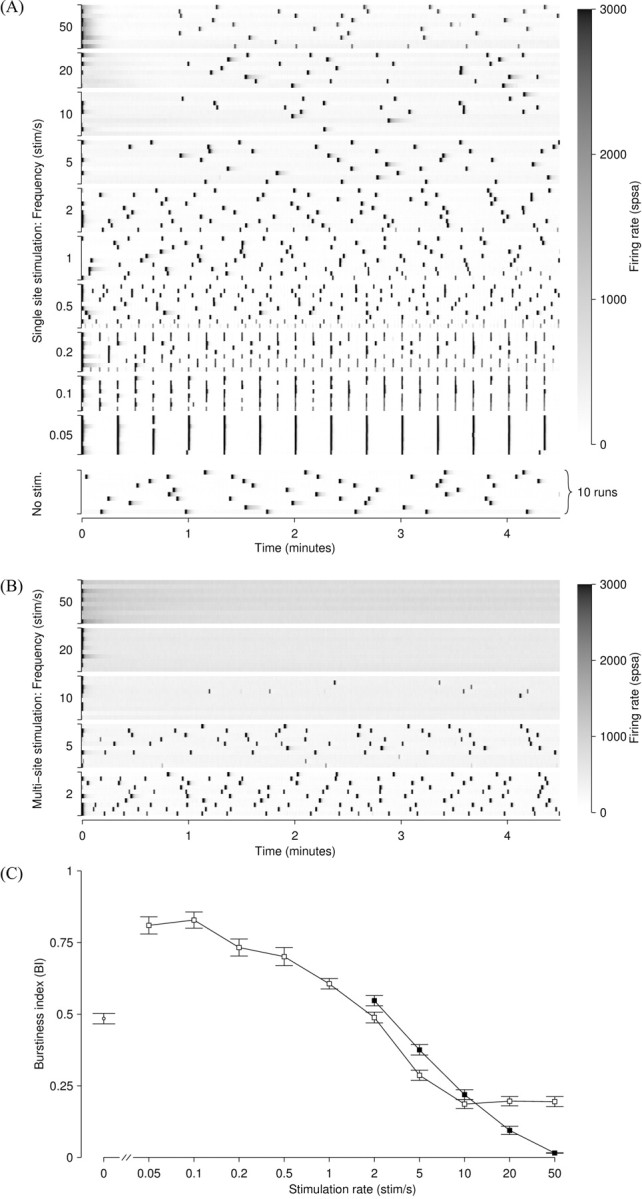
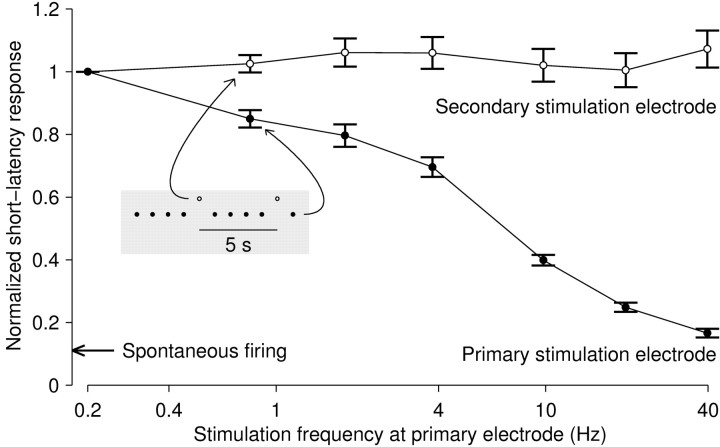
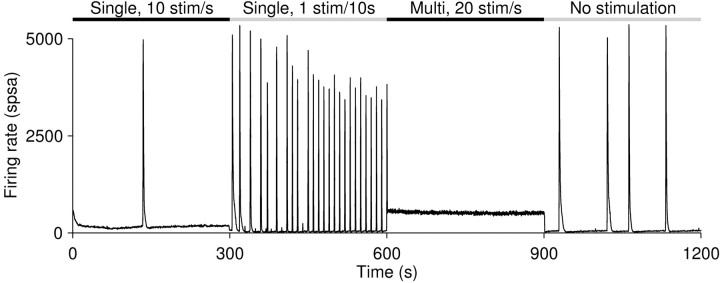
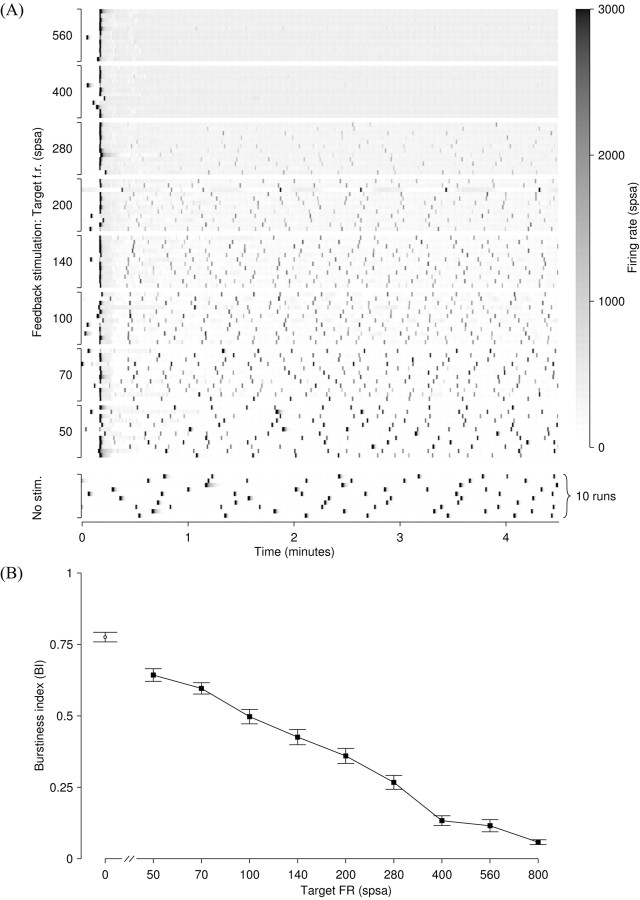
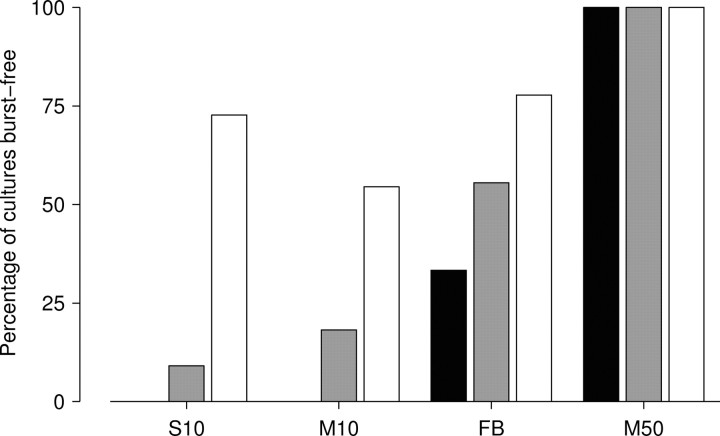
One of the major modes of activity of high-density cultures of dissociated neurons is globally synchronized bursting. Unlike in vivo, neuronal ensembles in culture maintain activity patterns dominated by global bursts for the lifetime of the culture (up to 2 years). We hypothesize that persistence of bursting is caused by a lack of input from other brain areas. To study this hypothesis, we grew small but dense monolayer cultures of cortical neurons and glia from rat embryos on multi-electrode arrays and used electrical stimulation to substitute for afferents. We quantified the burstiness of the firing of the cultures in spontaneous activity and during several stimulation protocols. Although slow stimulation through individual electrodes increased burstiness as a result of burst entrainment, rapid stimulation reduced burstiness. Distributing stimuli across several electrodes, as well as continuously fine-tuning stimulus strength with closed-loop feedback, greatly enhanced burst control. We conclude that externally applied electrical stimulation can substitute for natural inputs to cortical neuronal ensembles in transforming burst-dominated activity to dispersed spiking, more reminiscent of the awake cortex in vivo. This nonpharmacological method of controlling bursts will be a critical tool for exploring the information processing capacities of neuronal ensembles in vitro and has potential applications for the treatment of epilepsy.
Figures
Similar articles
-
Multi-site stimulation quiets network-wide spontaneous bursts and enhances functional plasticity in cultured cortical networks.Conf Proc IEEE Eng Med Biol Soc. 2006;2006:1593-6. doi: 10.1109/IEMBS.2006.260571. Conf Proc IEEE Eng Med Biol Soc. 2006. PMID: 17946052
-
Plasticity of recurring spatiotemporal activity patterns in cortical networks.Phys Biol. 2007 Oct 9;4(3):181-93. doi: 10.1088/1478-3975/4/3/005. Phys Biol. 2007. PMID: 17928657 Free PMC article.
-
An extremely rich repertoire of bursting patterns during the development of cortical cultures.BMC Neurosci. 2006 Feb 7;7:11. doi: 10.1186/1471-2202-7-11. BMC Neurosci. 2006. PMID: 16464257 Free PMC article.
-
Electrical activity patterns and the functional maturation of the neocortex.Eur J Neurosci. 2011 Nov;34(10):1677-86. doi: 10.1111/j.1460-9568.2011.07878.x. Eur J Neurosci. 2011. PMID: 22103424 Review.
-
Propagating waves of activity in the neocortex: what they are, what they do.Neuroscientist. 2008 Oct;14(5):487-502. doi: 10.1177/1073858408317066. Neuroscientist. 2008. PMID: 18997124 Free PMC article. Review.
Cited by
-
Closed-loop neuro-robotic experiments to test computational properties of neuronal networks.J Vis Exp. 2015 Mar 2;(97):52341. doi: 10.3791/52341. J Vis Exp. 2015. PMID: 25867052 Free PMC article.
-
MultiElec: A MATLAB Based Application for MEA Data Analysis.PLoS One. 2015 Jun 15;10(6):e0129389. doi: 10.1371/journal.pone.0129389. eCollection 2015. PLoS One. 2015. PMID: 26076010 Free PMC article.
-
Investigating the reliability of the evoked response in human iPSCs-derived neuronal networks coupled to micro-electrode arrays.APL Bioeng. 2023 Dec 20;7(4):046121. doi: 10.1063/5.0174227. eCollection 2023 Dec. APL Bioeng. 2023. PMID: 38130601 Free PMC article.
-
Development and plasticity of spontaneous activity and Up states in cortical organotypic slices.J Neurosci. 2007 May 30;27(22):5915-25. doi: 10.1523/JNEUROSCI.0447-07.2007. J Neurosci. 2007. PMID: 17537962 Free PMC article.
-
Spontaneous coordinated activity in cultured networks: analysis of multiple ignition sites, primary circuits, and burst phase delay distributions.J Comput Neurosci. 2008 Jun;24(3):346-57. doi: 10.1007/s10827-007-0059-1. Epub 2007 Dec 8. J Comput Neurosci. 2008. PMID: 18066657
References
-
- Ben-Ari Y (2001) Developing networks play a similar melody. Trends Neurosci 24: 353-360. - PubMed
-
- Ben-Menachem E, Mañus-Espaillat R, Ristanovic R, Wilder BJ, Stefan H, Mirza W, Tarver WB, Wernicke JF (1994) Vagus nerve stimulation for treatment of partial seizures: 1. A controlled study of effect on seizures. First International Vagus Nerve Stimulation Study Group. Epilepsia 35: 616-626. - PubMed
-
- Bove M, Grattarola M, Tedesco M, Verreschi G (1994) Characterization of growth and electrical activity of nerve cells cultured on microelectronic substrates-towards hybrid neuro-electronic devices. J Mater Sci Mater Med 5: 684-687.
-
- Bove M, Grattarola M, Verreschi G (1997) In vitro 2-D networks of neurons characterized by processing the signals recorded with a planar microtransducer array. IEEE Trans Biomed Eng 44: 964-977. - PubMed
-
- Brewer GJ, Cotman CW (1989) Survival and growth of hippocampal neurons in defined medium at low-density—advantages of a sandwich culture technique or low oxygen. Brain Res 494: 65-74. - PubMed
Publication types
MeSH terms
Grants and funding
LinkOut - more resources
Full Text Sources
Other Literature Sources