. 2005 Jan 19;25(3):711-22.
doi: 10.1523/JNEUROSCI.4034-04.2005.

Correlation between speed perception and neural activity in the middle temporal visual area

Affiliations

Correlation between speed perception and neural activity in the middle temporal visual area

Jing Liu et al. J Neurosci. .

Abstract

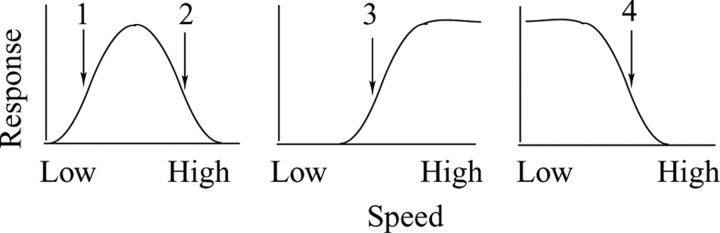
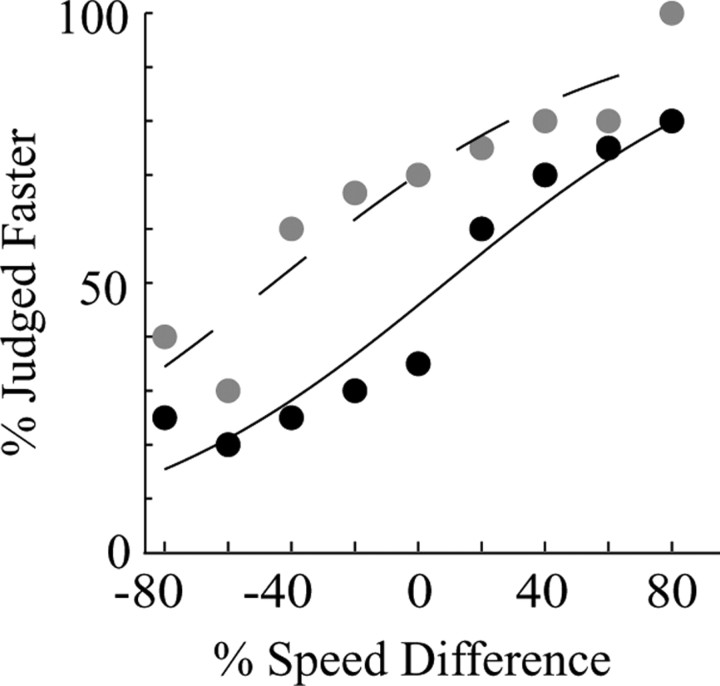
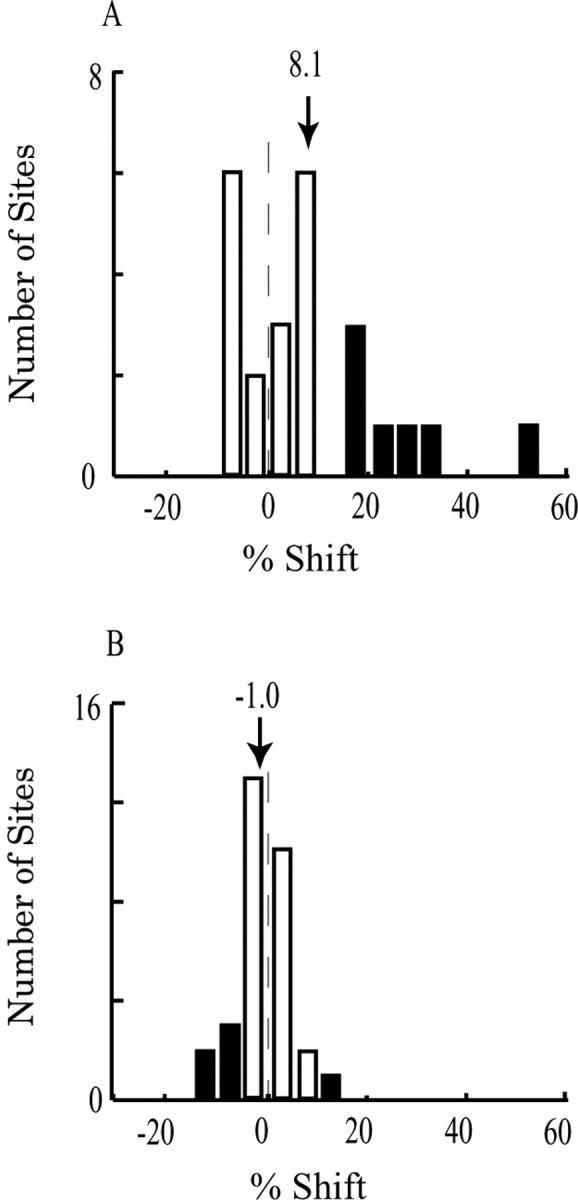
We conducted electrophysiological recording and microstimulation experiments to test the hypothesis that the middle temporal visual area (MT) plays a direct role in perception of the speed of moving visual stimuli. We trained rhesus monkeys on a speed discrimination task in which monkeys chose the faster speed of two moving random dot patterns presented simultaneously in spatially segregated apertures. In electrophysiological experiments, we analyzed the activity of speed-tuned MT neurons and multiunit clusters during the discrimination task. Neural activity was correlated with the monkeys' behavioral choices on a trial-to-trial basis (choice probability), and the correlation was predicted by the speed-tuning properties of each unit. In microstimulation experiments, we activated clusters of MT neurons with homogeneous speed-tuning properties during the same speed discrimination task. In one monkey, microstimulation biased speed judgments toward the preferred speed of the stimulated neurons. Together, evidence from these two experiments suggests that MT neurons play a direct role in the perception of visual speed. Comparison of psychometric and neurometric thresholds revealed that single and multineuronal signals were, on average, considerably less sensitive than were the monkeys perceptually, suggesting that signals must be pooled across neurons to account for performance.


Figures

Figure 1.
Figure 1.
Schematic illustration of the behavioral tasks. A, Fixation task. The arrow indicates the direction of dot movement. B, Spatial 2-AFC speed discrimination task. In the actual displays viewed by the monkeys, the visual stimuli were white dots presented on a dark background. The circles surrounding the apertures are for illustration only and were not present on the visual display. The dashed arrow indicates saccadic eye movement.
Figure 2.
Figure 2.
A, Psychophysical performance in one block of trials. The plot depicts the percentage of trials in which the monkey indicated that the speed in MT RF was faster as a function of the speed difference between the two apertures (relative to the slower speed of the two). Positive speed differences indicate that the stimulus inside the MT RF moved faster; negative speed differences indicate the converse. Perceptual threshold was 12.4% speed difference in this block. The reference speed for this experiment was 16°/s. B, The MU speed-tuning curve of the MT site under study while the monkey produced the behavioral data in A. The preferred speed is 76.8°/s. The arrow indicates the reference speed, and the gray box indicates the range of speeds used in the discrimination task. C, The direction-tuning curve of the same site, with a preferred direction of 289°. The dashed line indicates the spontaneous activity.
Figure 5.
Figure 5.
Computation of choice probabilities. A, Average firing rates and the SEs for the same experiment depicted in Figure 2 A. The MU speed- and direction-tuning curves for this site are shown in Figure 2, B and C. B, Distributions of firing rates for one trial type, in which the speed in RF was 7% slower than the speed outside RF (A, arrow). The two distributions (upward vs downward bars) are segregated on the basis of the monkey's decision on each trial. C, Frequency histogram of choice probabilities for sites in which the reference speed was positioned on the ascending shoulders of the tuning curves. The solid bars indicate sites for which the choice probability is significantly different from 0.5. The mean is 0.524 (n = 72 sites). D, Frequency histogram of choice probabilities for sites in which the reference speed was positioned on the descending shoulders of the tuning curves. The mean is 0.491 (n = 29 sites).
Figure 10.
Figure 10.
A, Frequency histogram of the relationship between neurometric and psychometric thresholds across all experiments. Data are depicted as threshold ratios (neuronal/psychophysical, N//P) and plotted in logarithmic scale for convenient visualization. Solid bars indicate SUs; the rest are MUs. B, Population psychometric (black data points and black curve) and neurometric (gray data points and gray curve) performance for the two monkeys. The mean and SE of psychometric performance and neurometric performance was plotted at each speed difference, and the population data were fitted with logistic regression.
Figure 9.
Figure 9.
Calculation of a neurometric function. Data are from the same recording site illustrated in Figure 5. A, The behavioral performance for this block (same as Fig. 2 A). The two stimulus conditions, indicated by arrows (one when IN was 7% faster and the other when IN was 7% slower), were used to illustrate the calculation of neurometric threshold in B. B, Frequency histograms of firing rates. Upward bars show data when the faster stimulus was inside the RF; downward bars show the converse. A signal detection analysis of these distributions (area under an ROC curve; see Materials and Methods) revealed that for this speed difference, the neuron could support discrimination performance of 57.5% correct by an ideal observer. C, Discrimination performance computed (as in A) for an ideal observer as a function of the speed difference between the apertures. Data points at mirror symmetric locations about zero (speed difference) are by definition identical. The arrow indicates the data point derived from the response distributions in A.
Figure 3.
Figure 3.
Summary of psychophysical thresholds in the speed discrimination task for the two monkeys. We binned the large range of reference speeds used during the experiments into five groups. The plots show the mean threshold and SE for each bin.
Figure 4.
Figure 4.
A schematic diagram of canonical MT speed-tuning curves (bandpass, high-pass, and low-pass) and how the relationship between firing rates and behavioral judgments could be predicted based on the positions of reference speeds (arrows) relative to the preferred speeds (see Results).
Figure 6.
Figure 6.
Time course of firing rates underlying the choice probability. Firing rates of each stimulus (Stim.) condition were normalized by the peak response for that condition and combined across all conditions and all cells with a significant choice probability of the predicted sign (see Results). The thickness of the shaded curves depicts one SE on each side of the mean. The dark curve represents trials in which monkeys chose the speed inside the RF as faster; the light curve represents trials in which monkeys chose the speed outside the RF as faster. The dashed line (and the axis on the right) is the difference of the two curves (IN - OUT). Each data point was calculated with a time bin of 50 ms; a sliding bin was incremented in 10 ms intervals to produce the plots. Time 0 is the onset of visual stimulus. The first bin includes spikes from -500 to -450 ms, and the data point is plotted at -450 ms (before stimulus onset). Thus, the data points are positioned at the right edge of each bin.
Figure 7.
Figure 7.
An example microstimulation effect produced at one MT site. The black data points and solid curve show the monkey's behavioral choices in the absence of microstimulation; the gray data points and the dashed curve show choices in the presence of microstimulation. Axis conventions are as in Figure 2 A.
Figure 8.
Figure 8.
Frequency histogram of microstimulation effects. Solid bars indicate sites for which effects were significantly different from 0. A, Effects in monkey Y (n = 24 sites). The mean shift of 8.1% indicates that microstimulation caused the monkeys to report speeds that were, on average, 8.1% closer to the preferred speed of the stimulation site. The effects could reflect either an increase in perceived speed (when the speed inside the RF was slower than the preferred speed of the stimulation site) or a decrease in perceived speed (when the speed inside the RF was faster than the preferred speed of the stimulates site). B, Absence of microstimulation effects in monkey C (n = 31 sites).

References

    1. Albright TD, Desimone R, Gross CG (1984) Columnar organization of directionally selective cells in visual area MT of the macaque. J Neurophysiol 51: 16-31. - PubMed
    1. Bair W, Zohary E, Newsome WT (2001) Correlated firing in macaque visual area MT: time scales and relationship to behavior. J Neurosci 21: 1676-1697. - PMC - PubMed
    1. Beauchamp MS, Cox RW, DeYoe EA (1997) Graded effects of spatial and featural attention on human area MT and associated motion processing areas. J Neurophysiol 78: 516-520. - PubMed
    1. Britten K, Shadlen M, Newsome W, Movshon J (1992) The analysis of visual motion: a comparison of neuronal and psychophysical performance. J Neurosci 12: 4745-4765. - PMC - PubMed
    1. Britten KH (2003) The middle temporal area: motion processing and the link to perception. In: Visual neurosciences, Ed 1 (Chalupa LM, Werner JS, eds). Cambridge, MA: MIT.