

Evolution of DNA sequence nonhomologies among maize inbreds
- PMID: 15659640
- PMCID: PMC548811
- DOI: 10.1105/tpc.104.025627
Evolution of DNA sequence nonhomologies among maize inbreds
Abstract
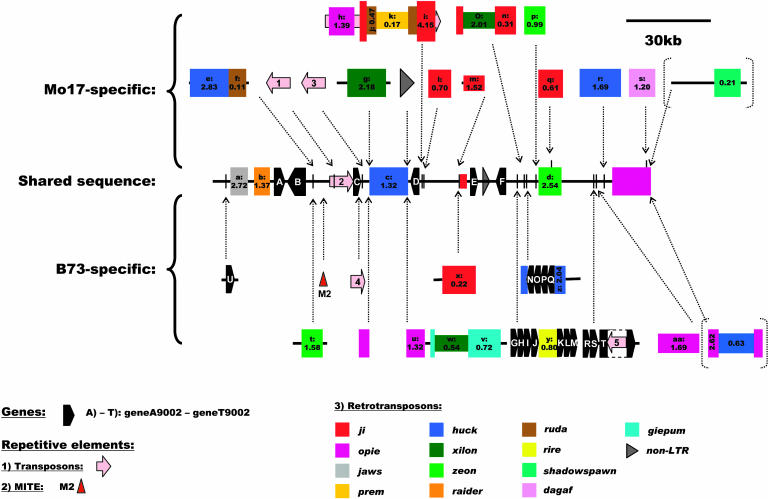
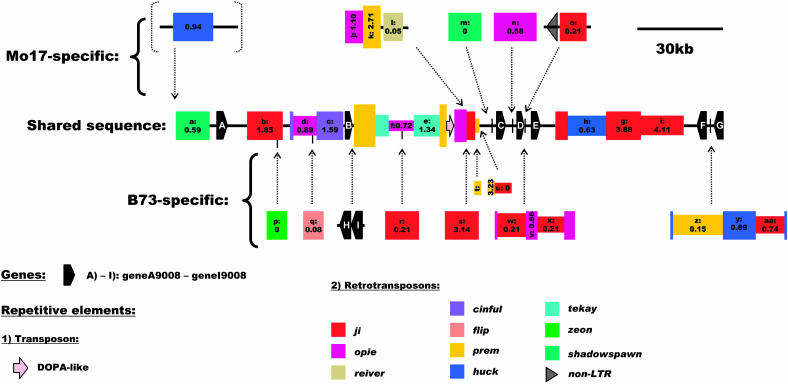
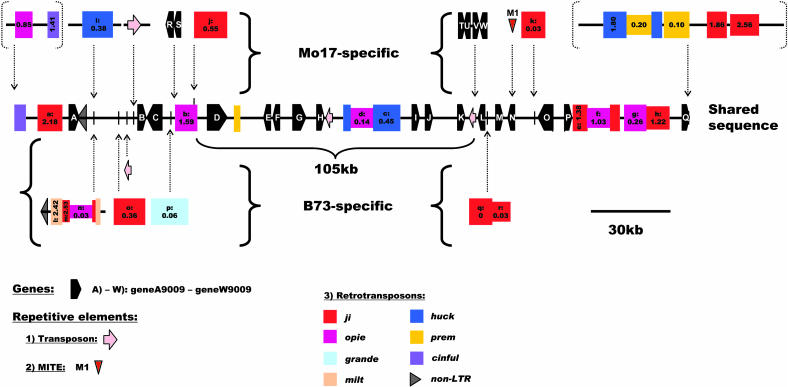
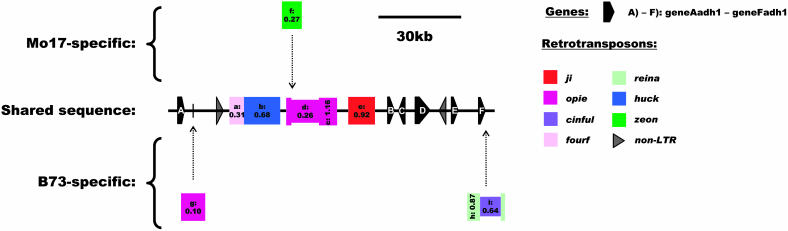
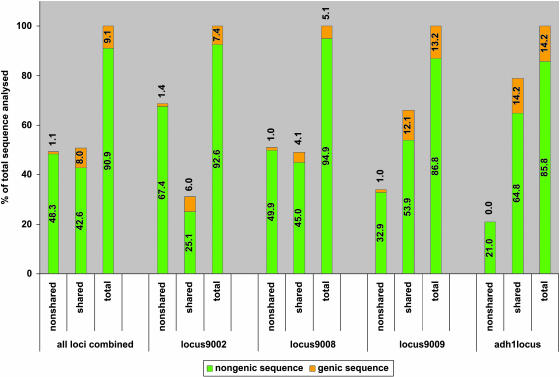
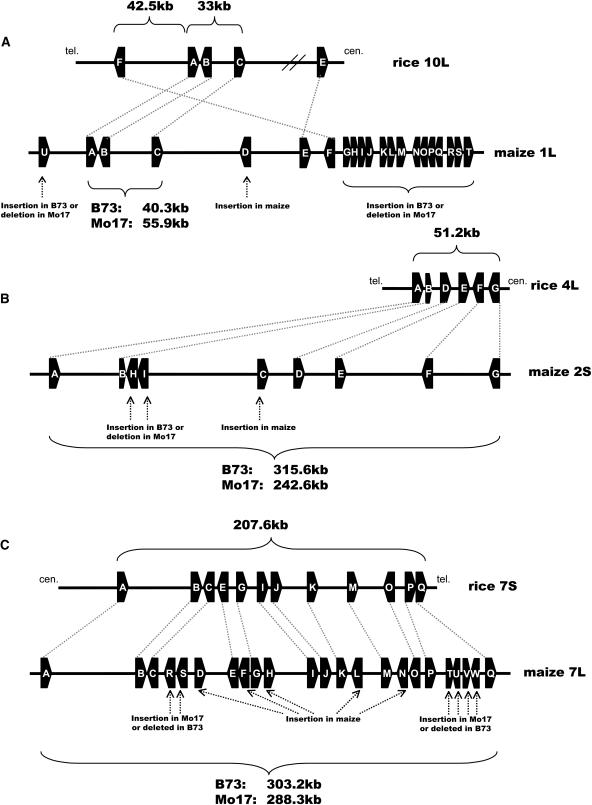
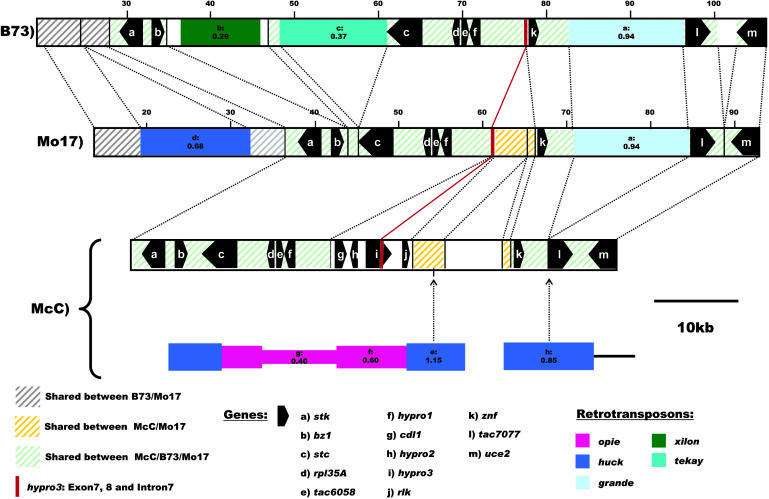
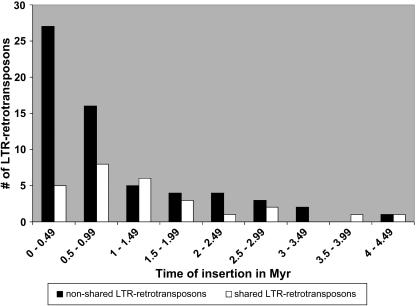
Allelic chromosomal regions totaling more than 2.8 Mb and located on maize (Zea mays) chromosomes 1L, 2S, 7L, and 9S have been sequenced and compared over distances of 100 to 350 kb between the two maize inbred lines Mo17 and B73. The alleles contain extended regions of nonhomology. On average, more than 50% of the compared sequence is noncolinear, mainly because of the insertion of large numbers of long terminal repeat (LTR)-retrotransposons. Only 27 LTR-retroelements are shared between alleles, whereas 62 are allele specific. The insertion of LTR-retrotransposons into the maize genome is statistically more recent for nonshared than shared ones. Most surprisingly, more than one-third of the genes (27/72) are absent in one of the inbreds at the loci examined. Such nonshared genes usually appear to be truncated and form clusters in which they are oriented in the same direction. However, the nonshared genome segments are gene-poor, relative to regions shared by both inbreds, with up to 12-fold difference in gene density. By contrast, miniature inverted terminal repeats (MITEs) occur at a similar frequency in the shared and nonshared fractions. Many times, MITES are present in an identical position in both LTRs of a retroelement, indicating that their insertion occurred before the replication of the retroelement in question. Maize ESTs and/or maize massively parallel signature sequencing tags were identified for the majority of the nonshared genes or homologs of them. In contrast with shared genes, which are usually conserved in gene order and location relative to rice (Oryza sativa), nonshared genes violate the maize colinearity with rice. Based on this, insertion by a yet unknown mechanism, rather than deletion events, seems to be the origin of the nonshared genes. The intergenic space between conserved genes is enlarged up to sixfold in maize compared with rice. Frequently, retroelement insertions create a different sequence environment adjacent to conserved genes.
Figures
Similar articles
-
The Wukong Terminal-Repeat Retrotransposon in Miniature (TRIM) Elements in Diverse Maize Germplasm.G3 (Bethesda). 2015 May 26;5(8):1585-92. doi: 10.1534/g3.115.018317. G3 (Bethesda). 2015. PMID: 26019188 Free PMC article.
-
Exceptional diversity, non-random distribution, and rapid evolution of retroelements in the B73 maize genome.PLoS Genet. 2009 Nov;5(11):e1000732. doi: 10.1371/journal.pgen.1000732. Epub 2009 Nov 20. PLoS Genet. 2009. PMID: 19936065 Free PMC article.
-
Computational finishing of large sequence contigs reveals interspersed nested repeats and gene islands in the rf1-associated region of maize.Plant Physiol. 2009 Oct;151(2):483-95. doi: 10.1104/pp.109.143370. Epub 2009 Aug 12. Plant Physiol. 2009. PMID: 19675151 Free PMC article.
-
Abundance, distribution, and transcriptional activity of repetitive elements in the maize genome.Genome Res. 2001 Oct;11(10):1660-76. doi: 10.1101/gr.188201. Genome Res. 2001. PMID: 11591643 Free PMC article.
-
Gene galaxies in the maize genome.Proc Natl Acad Sci U S A. 2001 Jul 17;98(15):8163-4. doi: 10.1073/pnas.161278798. Proc Natl Acad Sci U S A. 2001. PMID: 11459945 Free PMC article. Review. No abstract available.
Cited by
-
Perturbation of maize phenylpropanoid metabolism by an AvrE family type III effector from Pantoea stewartii.Plant Physiol. 2015 Mar;167(3):1117-35. doi: 10.1104/pp.114.253120. Epub 2015 Jan 29. Plant Physiol. 2015. PMID: 25635112 Free PMC article.
-
Mendelian and non-Mendelian regulation of gene expression in maize.PLoS Genet. 2013;9(1):e1003202. doi: 10.1371/journal.pgen.1003202. Epub 2013 Jan 17. PLoS Genet. 2013. PMID: 23341782 Free PMC article.
-
Remarkable variation in maize genome structure inferred from haplotype diversity at the bz locus.Proc Natl Acad Sci U S A. 2006 Nov 21;103(47):17644-9. doi: 10.1073/pnas.0603080103. Epub 2006 Nov 13. Proc Natl Acad Sci U S A. 2006. PMID: 17101975 Free PMC article.
-
High-Throughput and Accurate Determination of Transgene Copy Number and Zygosity in Transgenic Maize: From DNA Extraction to Data Analysis.Int J Mol Sci. 2021 Nov 19;22(22):12487. doi: 10.3390/ijms222212487. Int J Mol Sci. 2021. PMID: 34830369 Free PMC article.
-
Genome-wide meta-analysis of maize heterosis reveals the potential role of additive gene expression at pericentromeric loci.BMC Plant Biol. 2014 Apr 2;14:88. doi: 10.1186/1471-2229-14-88. BMC Plant Biol. 2014. PMID: 24693880 Free PMC article.
References
-
- Arabidopsis Genome Initiative (2000). Analysis of the genome sequence of the flowering plant Arabidopsis thaliana. Nature 408, 796–815. - PubMed
-
- Bennetzen, J.L. (2002). Mechanisms and rates of genome expansion and contraction in flowering plants. Genetica 115, 29–36. - PubMed
-
- Bennetzen, J.L., and Ma, J. (2003). The genetic colinearity of rice and other cereals on the basis of genomic sequence analysis. Curr. Opin. Plant Biol. 6, 128–133. - PubMed
Publication types
MeSH terms
Substances
Associated data
- Actions
- Actions
- Actions
- Actions
- Actions
- Actions
- Actions
- Actions
LinkOut - more resources
Full Text Sources
Other Literature Sources
Miscellaneous
