. 2005 Feb;187(3):813-21.
doi: 10.1128/JB.187.3.813-821.2005.

Acetic acid induces expression of the Staphylococcus aureus cidABC and lrgAB murein hydrolase regulator operons

Affiliations

Acetic acid induces expression of the Staphylococcus aureus cidABC and lrgAB murein hydrolase regulator operons

Kelly C Rice et al. J Bacteriol. 2005 Feb.

Abstract

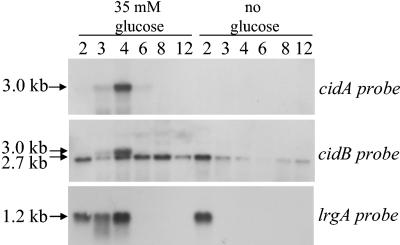
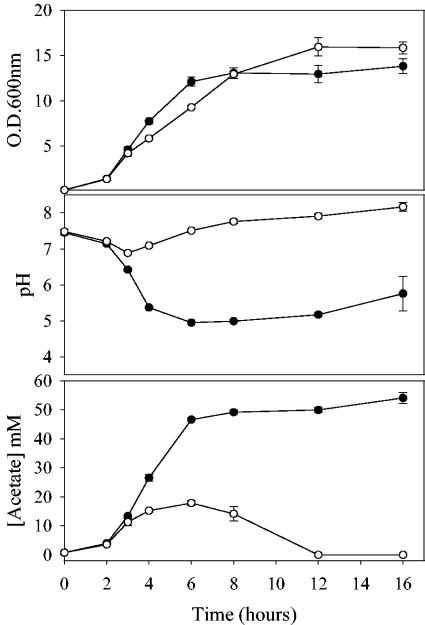
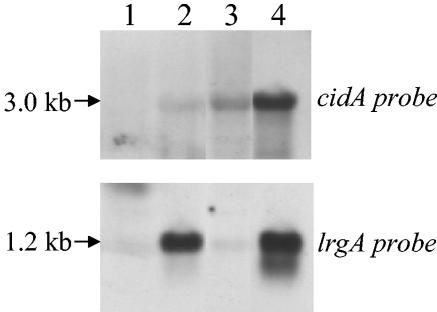
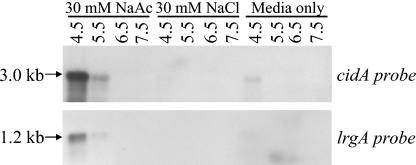
The Staphylococcus aureus lrg and cid operons encode homologous proteins that regulate extracellular murein hydrolase activity and penicillin tolerance in a diametrically opposing manner. Although their specific regulatory functions remain unknown, it has been postulated that the functions of CidA and LrgA are analogous to those of bacteriophage holins and antiholins, respectively, and that these proteins serve as molecular control elements of bacterial programmed cell death. Although these studies demonstrated that cidBC transcription is abundant in sigmaB-proficient strains, cidABC transcription was only minimally expressed under standard growth conditions. In this study, we demonstrate that cidABC and lrgAB transcription in the clinical isolate UAMS-1 is induced by growth in the presence of 35 mM glucose and that this enhances murein hydrolase activity and decreases tolerance to vancomycin and rifampin. The effect of glucose on murein hydrolase activity was not observed in the cidA mutant, indicating that the induction of this activity was dependent on enhanced cidABC expression. Furthermore, we demonstrate that the effects of glucose on cidABC and lrgAB transcription are mediated by the generation of acetic acid produced by the metabolism of this and other carbon sources. These results shed new light on the control of the S. aureus cidABC and lrgAB genes and demonstrate that these operons, as well as murein hydrolase activity and antibiotic tolerance, are responsive to carbohydrate metabolism.


Figures

FIG. 1.
FIG. 1.
Northern blot analysis of cid and lrg transcription in S. aureus UAMS-1. Total cellular RNA was isolated from UAMS-1 cells cultured in NZY broth in either the presence of 35 mM glucose or in the absence of glucose at 2, 3, 4, 6, 8, and 12 h postinoculum (as indicated above each lane of the blot). Ten micrograms of each RNA sample was separated through a 1% (wt/vol) agarose-formaldehyde gel, transferred to a nylon membrane, and hybridized to cidA-, cidB-, and lrgA-specific DIG-labeled probes. The sizes of each transcript were determined by comparison to an RNA ladder (Invitrogen) run on the same gel. It should be noted that the corresponding culture cell density (as measured by the OD600), pH, and acetate concentration for each time point in this experiment are represented in Fig. 5.
FIG. 2.
FIG. 2.
Quantitative cell wall hydrolysis assay (A) and zymogram analysis (B) of extracellular murein hydrolase activities of UAMS-1 and KB1050. (A) Aliquots of 50 μg of extracellular proteins isolated from 16-h cultures of UAMS-1 (wild-type; circles) and KB1050 (cidA mutant; triangles) grown in NZY broth in either the presence of 35 mM glucose (closed symbols) or in the absence of glucose (open symbols) were each added to a 1-mg · ml−1 suspension of M. luteus cell walls, and the murein hydrolase activity of each sample was measured as a decrease in turbidity over a 4-h time course experiment. These data represent the average of three independent experiments, and the error bars correspond to the standard errors of the means. (B) Fifteen micrograms of extracellular proteins, isolated from 16-h cultures of UAMS-1 and KB1050 grown in either the presence of 35 mM glucose or in the absence of glucose, was separated in a sodium dodecyl sulfate-polyacrylamide gel electrophoresis gel containing 1 mg of M. luteus cell wall · ml−1, followed by an overnight incubation at 37°C in a buffer containing Triton X-100 and staining with methylene blue. This zymogram is representative of results obtained from three independent experiments. The migrations of molecular mass markers (in kilodaltons) are indicated to the left of the gel. Lane 1, UAMS-1 (no glucose); lane 2, KB1050 (no glucose); lane 3, UAMS-1 (35 mM glucose); lane 4, KB1050 (35 mM glucose).
FIG. 3.
FIG. 3.
Comparison of the effect of glucose on antibiotic sensitivity between UAMS-1 and KB1050. Vancomycin (40 μg · ml−1) or rifampin (2 μg · ml−1) was added to cultures of UAMS-1 (wild-type; circles) and KB1050 (cidA mutant; triangles) cells grown in NZY broth in either the presence of 35 mM glucose (closed symbols) or in the absence of glucose (open symbols), and viable cell counts of each culture were determined by dilution plating on tryptic soy agar. These data represent the average of three independent experiments, and error bars correspond to the standard errors of the means. (A and B) Graphs depicting the CFU per milliliter of each culture before and after addition of vancomycin (A) or rifampin (B). The time at which each antibiotic was added to each culture is indicated by an arrow. (C and D) Graphs depicting the percent viability relative to the time of vancomycin (C) or rifampin (D) addition (referred to as the zero time point) for each culture.
FIG. 4.
FIG. 4.
Light microscopy of UAMS-1 and KB1050. Cultures of UAMS-1 and KB1050 were grown in NZY broth to early stationary phase, and aliquots were heat fixed to glass slides and stained with Gram's crystal violet. Each micrograph is representative of several fields of view. Magnification, ×1,000.
FIG. 5.
FIG. 5.
Comparison of the growth rate, pH, and acetate concentration in UAMS-1 cultures grown in the presence and absence of glucose. The growth rate, as determined by the OD600 (top graph), pH (middle graph), and acetate concentration (bottom graph), was measured in UAMS-1 cultures grown in NZY broth in either the presence of 35 mM glucose (closed circles) or in the absence of glucose (open circles). Each parameter represents the average of three independent experiments, and error bars correspond to the standard errors of the means.
FIG. 6.
FIG. 6.
Transcription of cidABC and lrgAB is increased by the presence of acetic acid in S. aureus UAMS-1. Total cellular RNA was isolated from UAMS-1 grown to late exponential growth phase (4 h postinoculum) in either NZY pH 7.5 (lane 1), NZY pH 7.5 plus 35 mM glucose (lane 2), NZY pH 5.0 (HCl) (lane 3), or NZY pH 5.0 (acetic acid) (lane 4), and 10 μg of each sample was separated through a 1% (wt/vol) agarose-formaldehyde gel, transferred to a nylon membrane, and hybridized to cidA- and lrgA-specific DIG-labeled probes. The sizes of each transcript were determined by comparison to an RNA ladder (Invitrogen) run on the same gel.
FIG. 7.
FIG. 7.
Effect of pH on the ability of acetate to increase transcription of cidABC and lrgAB in S. aureus UAMS-1. Total cellular RNA was isolated from UAMS-1 cells grown to the mid-exponential growth phase (4 h postinoculum) in NZY at increasing pH values (from 4.5 to 7.5, as indicated above each lane of the blot), containing either 30 mM sodium acetate or 30 mM sodium chloride as indicated. Five micrograms of each sample was separated through a 1% (wt/vol) agarose-formaldehyde gel, transferred to a nylon membrane, and hybridized to cidA- and lrgA-specific DIG-labeled probes. The sizes of each transcript were determined by comparison to an RNA ladder (Invitrogen) run on the same gel.

References

    1. Abdel-Hamid, A. M., M. M. Attwood, and J. R. Guest. 2001. Pyruvate oxidase contributes to the aerobic growth efficiency of Escherichia coli. Microbiology 147:1483-1498. - PubMed
    1. Axe, D. D., and J. E. Bailey. 1995. Transport of lactate and acetate through the energized cytoplasmic membrane of Escherichia coli. Biotechnol. Bioeng. 47:8-19. - PubMed
    1. Bayles, K. W. 2003. Are the molecular strategies that control apoptosis conserved in bacteria? Trends Microbiol. 11:306-311. - PubMed
    1. Bayles, K. W. 2000. The bactericidal action of penicillin: new clues to an unsolved mystery. Trends Microbiol. 8:274-278. - PubMed
    1. Beenken, K. E., J. S. Blevins, and M. S. Smeltzer. 2003. Mutation of sarA in Staphylococcus aureus limits biofilm formation. Infect. Immun. 71:4206-4211. - PMC - PubMed

Publication types

MeSH terms

LinkOut - more resources