

Sulfur and nitrogen limitation in Escherichia coli K-12: specific homeostatic responses
- PMID: 15659685
- PMCID: PMC545709
- DOI: 10.1128/JB.187.3.1074-1090.2005
Sulfur and nitrogen limitation in Escherichia coli K-12: specific homeostatic responses
Abstract
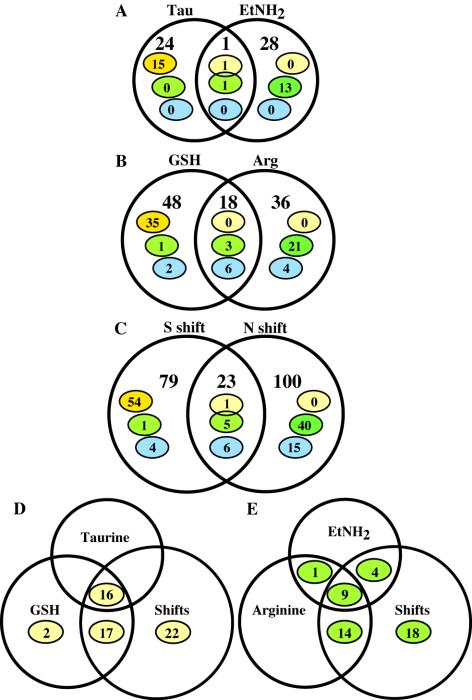
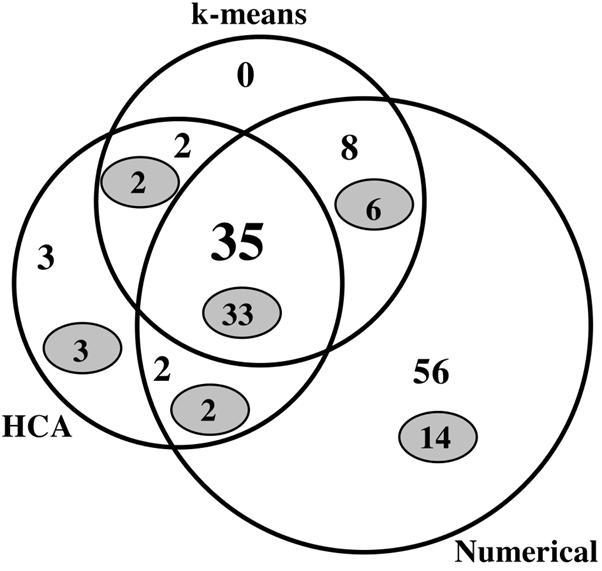
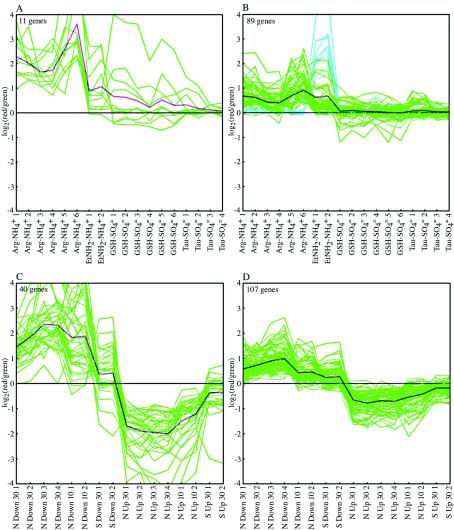
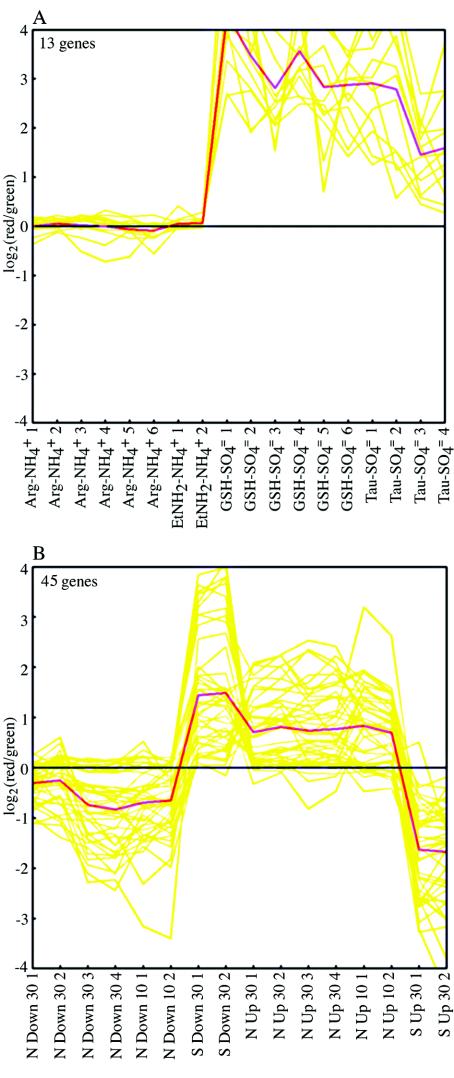
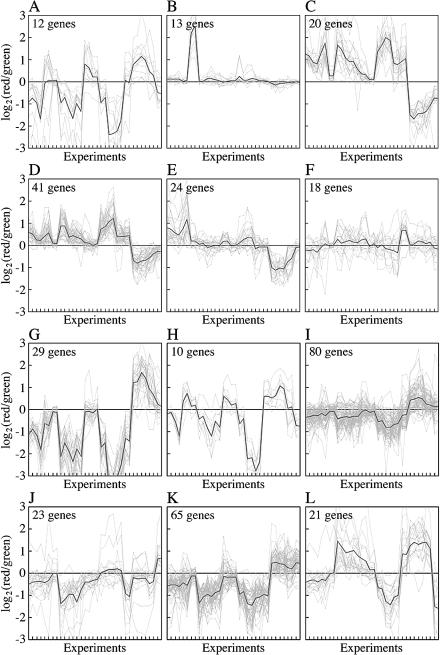
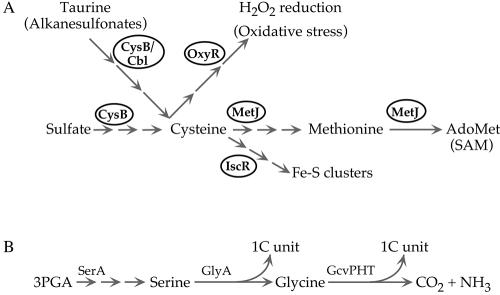
We determined global transcriptional responses of Escherichia coli K-12 to sulfur (S)- or nitrogen (N)-limited growth in adapted batch cultures and cultures subjected to nutrient shifts. Using two limitations helped to distinguish between nutrient-specific changes in mRNA levels and common changes related to the growth rate. Both homeostatic and slow growth responses were amplified upon shifts. This made detection of these responses more reliable and increased the number of genes that were differentially expressed. We analyzed microarray data in several ways: by determining expression changes after use of a statistical normalization algorithm, by hierarchical and k-means clustering, and by visual inspection of aligned genome images. Using these tools, we confirmed known homeostatic responses to global S limitation, which are controlled by the activators CysB and Cbl, and found that S limitation propagated into methionine metabolism, synthesis of FeS clusters, and oxidative stress. In addition, we identified several open reading frames likely to respond specifically to S availability. As predicted from the fact that the ddp operon is activated by NtrC, synthesis of cross-links between diaminopimelate residues in the murein layer was increased under N-limiting conditions, as was the proportion of tripeptides. Both of these effects may allow increased scavenging of N from the dipeptide D-alanine-D-alanine, the substrate of the Ddp system.
Figures
Similar articles
-
Revealing systematic changes in the transcriptome during the transition from exponential growth to stationary phase.mSystems. 2025 Jan 21;10(1):e0131524. doi: 10.1128/msystems.01315-24. Epub 2024 Dec 23. mSystems. 2025. PMID: 39714213 Free PMC article.
-
Lessons from Escherichia coli genes similarly regulated in response to nitrogen and sulfur limitation.Proc Natl Acad Sci U S A. 2005 Mar 1;102(9):3453-8. doi: 10.1073/pnas.0500141102. Epub 2005 Feb 16. Proc Natl Acad Sci U S A. 2005. PMID: 15716358 Free PMC article.
-
Nitrogen regulatory protein C-controlled genes of Escherichia coli: scavenging as a defense against nitrogen limitation.Proc Natl Acad Sci U S A. 2000 Dec 19;97(26):14674-9. doi: 10.1073/pnas.97.26.14674. Proc Natl Acad Sci U S A. 2000. PMID: 11121068 Free PMC article.
-
Global gene expression profiling in Escherichia coli K12: effects of oxygen availability and ArcA.J Biol Chem. 2005 Apr 15;280(15):15084-96. doi: 10.1074/jbc.M414030200. Epub 2005 Feb 7. J Biol Chem. 2005. PMID: 15699038
-
Sulfonate-sulfur metabolism and its regulation in Escherichia coli.Arch Microbiol. 2001 Jul;176(1-2):1-8. doi: 10.1007/s002030100298. Arch Microbiol. 2001. PMID: 11479697 Review.
Cited by
-
Genome-scale metabolic modelling when changes in environmental conditions affect biomass composition.PLoS Comput Biol. 2021 May 24;17(5):e1008528. doi: 10.1371/journal.pcbi.1008528. eCollection 2021 May. PLoS Comput Biol. 2021. PMID: 34029317 Free PMC article.
-
Prosecutor: parameter-free inference of gene function for prokaryotes using DNA microarray data, genomic context and multiple gene annotation sources.BMC Genomics. 2008 Oct 21;9:495. doi: 10.1186/1471-2164-9-495. BMC Genomics. 2008. PMID: 18939968 Free PMC article.
-
Escherichia coli segments its controls on carbon-dependent gene expression into global and specific regulations.Microb Biotechnol. 2021 May;14(3):1084-1106. doi: 10.1111/1751-7915.13776. Epub 2021 Mar 2. Microb Biotechnol. 2021. PMID: 33650807 Free PMC article.
-
Nutrient-Limited Operational Strategies for the Microbial Production of Biochemicals.Microorganisms. 2022 Nov 10;10(11):2226. doi: 10.3390/microorganisms10112226. Microorganisms. 2022. PMID: 36363817 Free PMC article. Review.
-
Furfural inhibits growth by limiting sulfur assimilation in ethanologenic Escherichia coli strain LY180.Appl Environ Microbiol. 2009 Oct;75(19):6132-41. doi: 10.1128/AEM.01187-09. Epub 2009 Aug 14. Appl Environ Microbiol. 2009. PMID: 19684179 Free PMC article.
References
-
- Blattner, F. R., G. Plunkett, C. A. Bloch, N. T. Perna, V. Burland, M. Riley, J. ColladoVides, J. D. Glasner, C. K. Rode, G. F. Mayhew, J. Gregor, N. W. Davis, H. A. Kirkpatrick, M. A. Goeden, D. J. Rose, B. Mau, and Y. Shao. 1997. The complete genome sequence of Escherichia coli K-12. Science 277:1453-1474. - PubMed
-
- Bykowski, T., J. R. van der Ploeg, R. Iwanicka-Nowicka, and M. M. Hryniewicz. 2002. The switch from inorganic to organic sulphur assimilation in Escherichia coli: adenosine 5′-phosphosulphate (APS) as a signalling molecule for sulphate excess. Mol. Microbiol. 43:1347-1358. - PubMed
Publication types
MeSH terms
Substances
Grants and funding
LinkOut - more resources
Full Text Sources
Other Literature Sources
Molecular Biology Databases
Research Materials
Miscellaneous
