. 2005 Feb;187(3):1135-60.
doi: 10.1128/JB.187.3.1135-1160.2005.

Genome-wide expression analysis indicates that FNR of Escherichia coli K-12 regulates a large number of genes of unknown function

Affiliations

Genome-wide expression analysis indicates that FNR of Escherichia coli K-12 regulates a large number of genes of unknown function

Yisheng Kang et al. J Bacteriol. 2005 Feb.

Abstract

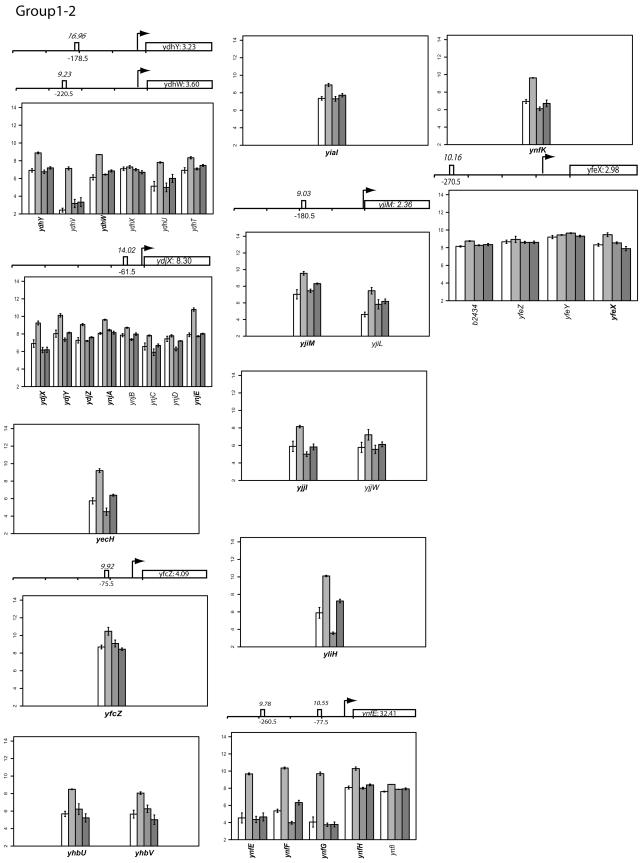
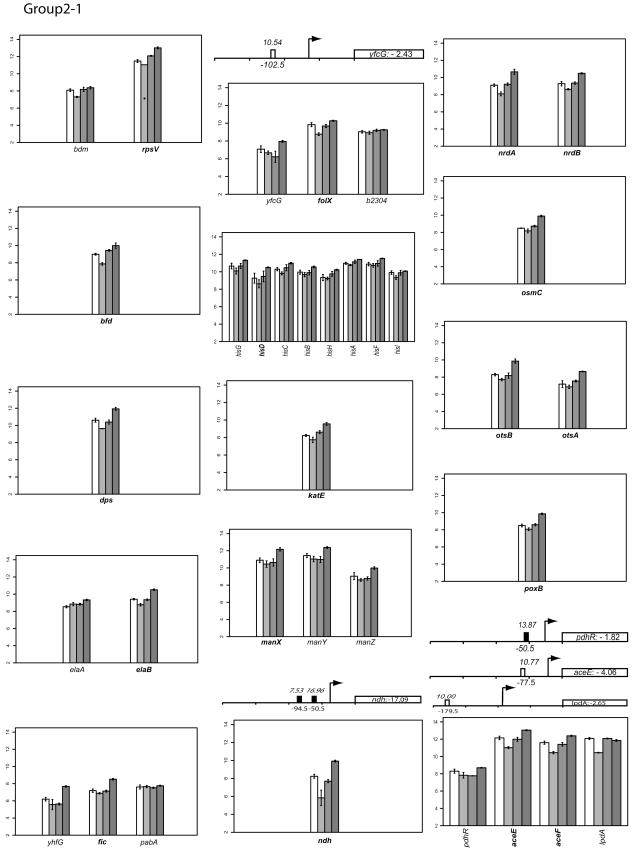
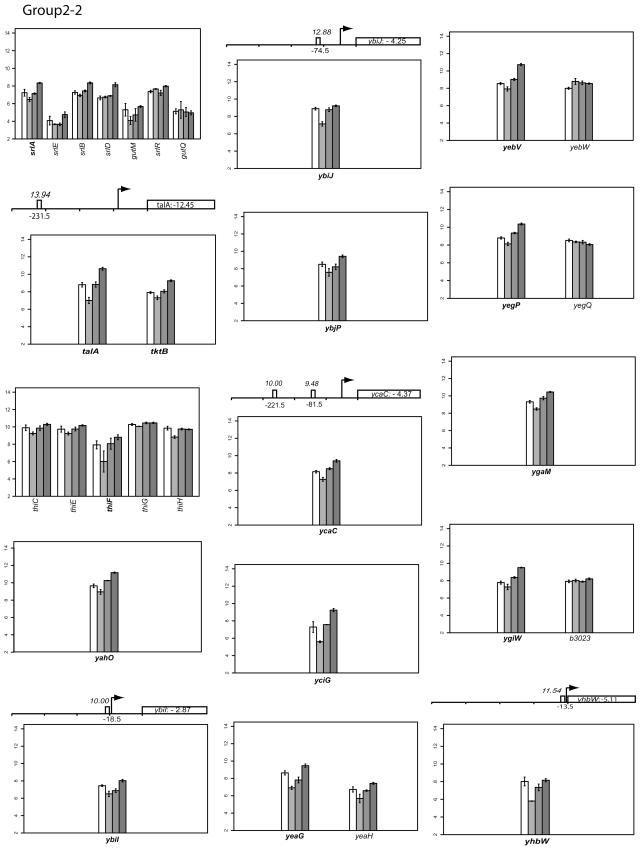
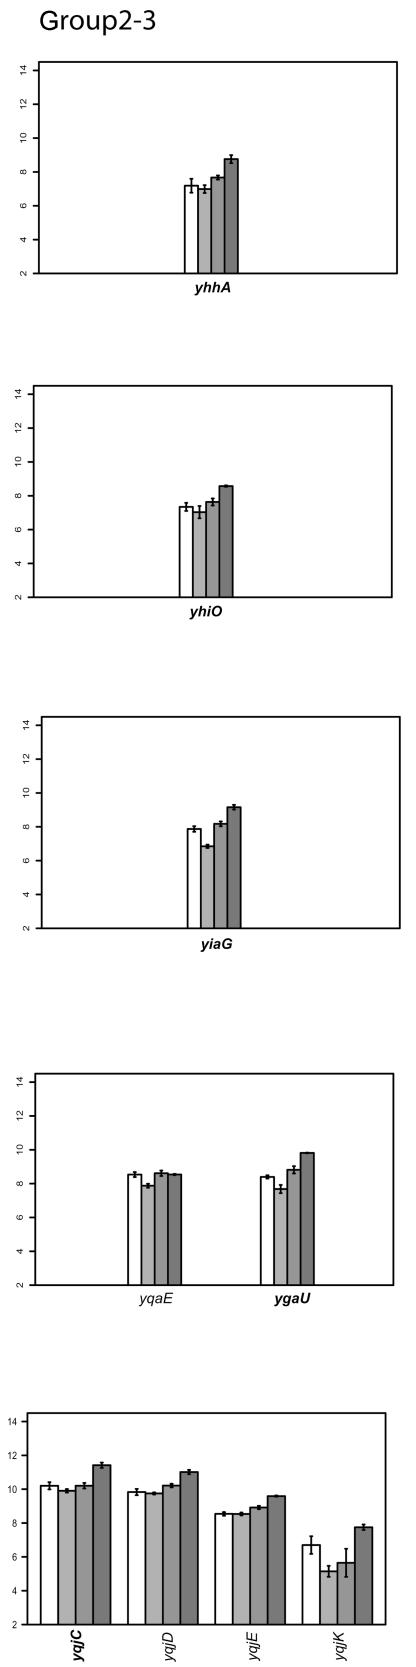
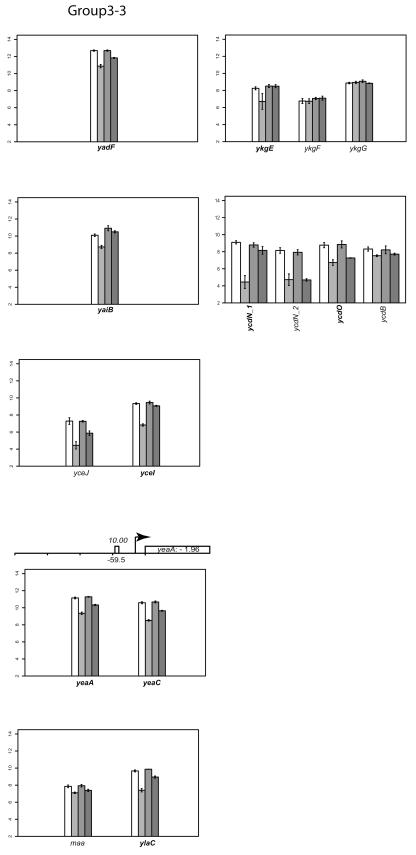
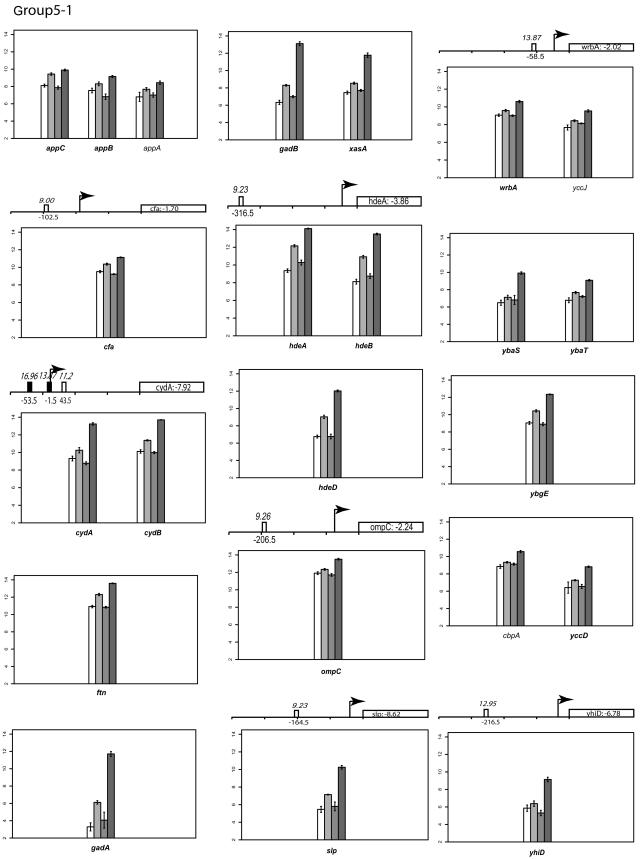
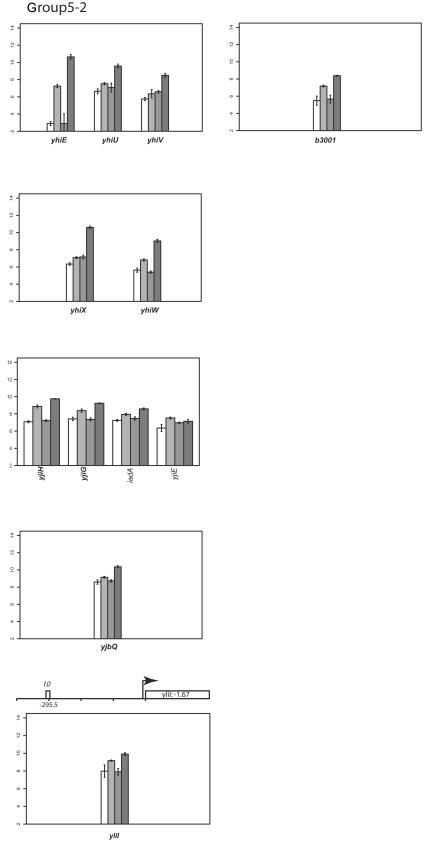
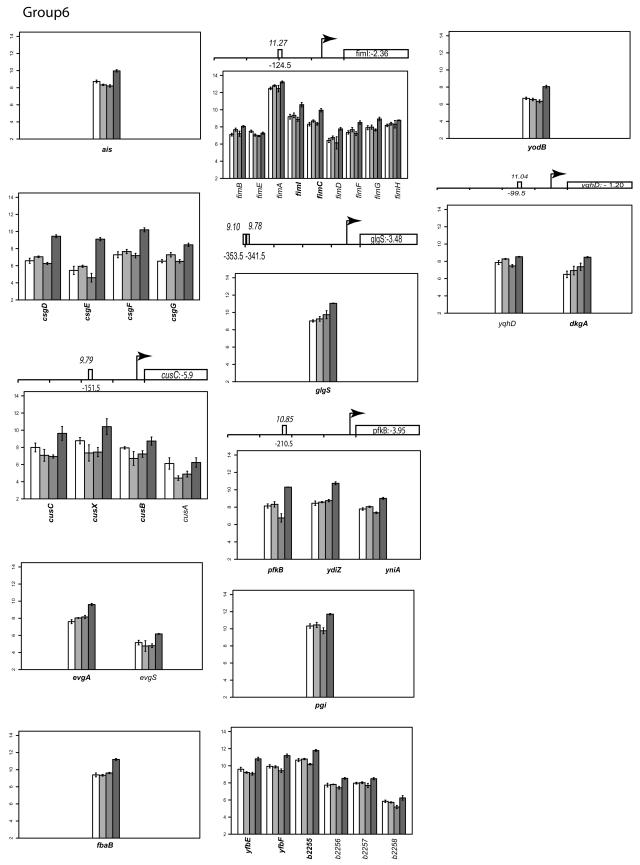
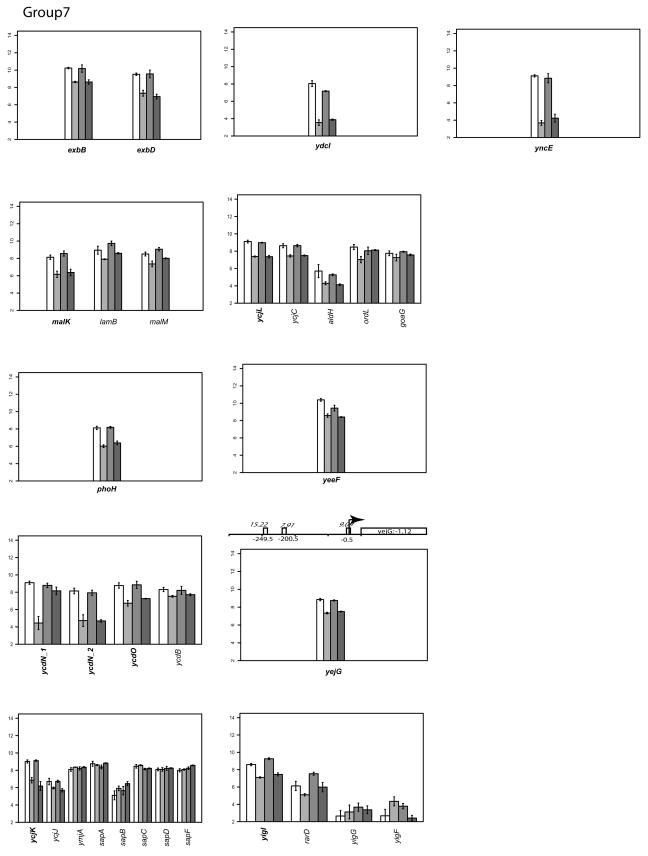
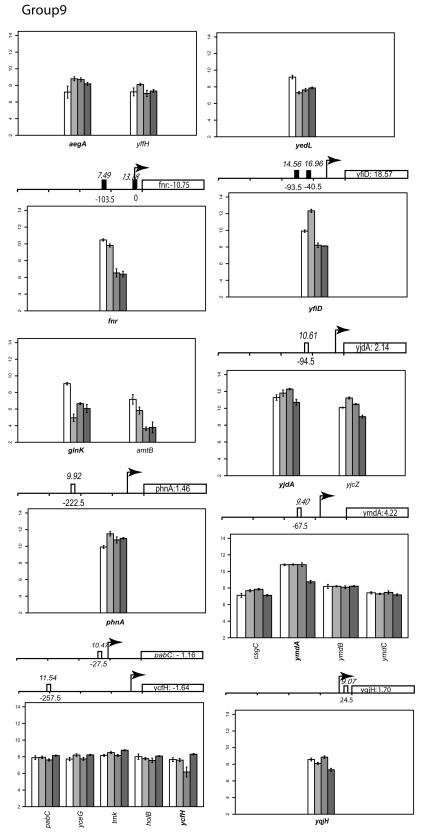
The major regulator controlling the physiological switch between aerobic and anaerobic growth conditions in Escherichia coli is the DNA binding protein FNR. To identify genes controlled by FNR, we used Affymetrix Antisense GeneChips to compare global gene expression profiles from isogenic MG1655 wild-type and Deltafnr strains grown in glucose minimal media under aerobic or anaerobic conditions. We found that 297 genes contained within 184 operons were regulated by FNR and/or by O2 levels. The expression of many genes known to be involved in anaerobic respiration and fermentation was increased under anaerobic growth conditions, while that of genes involved in aerobic respiration and the tricarboxylic acid cycle were repressed as expected. The expression of nine operons associated with acid resistance was also increased under anaerobic growth conditions, which may reflect the production of acidic fermentation products. Ninety-one genes with no presently defined function were also altered in expression, including seven of the most highly anaerobically induced genes, six of which we found to be directly regulated by FNR. Classification of the 297 genes into eight groups by k-means clustering analysis indicated that genes with common gene expression patterns also had a strong functional relationship, providing clues for studying the function of unknown genes in each group. Six of the eight groups showed regulation by FNR; while some expression groups represent genes that are simply activated or repressed by FNR, others, such as those encoding functions for chemotaxis and motility, showed a more complex pattern of regulation. A computer search for FNR DNA binding sites within predicted promoter regions identified 63 new sites for 54 genes. We suggest that E. coli MG1655 has a larger metabolic potential under anaerobic conditions than has been previously recognized.


Figures

FIG. 1.
FIG. 1.
Changes in expression of energy-generating pathways of E. coli under anaerobic conditions. Changes in expression of fermentation pathways, TCA cycle, and electron transport systems from the global gene expression data are represented by the different color intensities of lines and protein names, where dark blue are the most anaerobically repressed functions and dark red are the most anaerobically activated functions. The three major branch points that determine the fluxes of carbon and electrons through the various pathways are labeled in bold and larger font. This figure is adapted from Spiro and Guest (82) and Alexeeva et al. (1). The direction of the triangles indicates whether the gene product is positively (Δ) or negatively (▿) regulated by FNR.
FIG.2.
FIG.2.
Classifying gene expression patterns by k-means clustering analysis. The log2 transcription levels are plotted as histograms for each gene (the wild type [left two bars] and the FNR strain [right two bars] under aerobic and anaerobic conditions, respectively). Any member of a known or predicted polycistronic operon that meets our criteria for differential expression is indicated in bold. The whole operon is shown for comparison. FNR binding sites in the upstream region of a gene are represented by a bar (solid, documented; open, predicted). The italicized number above the box is the ScanAce quality score for each FNR site; the number below is the distance from the FNR site to the transcriptional start site. Black arrows indicate the position and the orientation of transcriptional start sites of each operon either documented or predicted by RegulonDB or by Bockhorst et al. (8). Tick bars are spaced at 100-bp intervals. Error bars represent standard deviations of results from three replicates.
FIG.2.
FIG.2.
Classifying gene expression patterns by k-means clustering analysis. The log2 transcription levels are plotted as histograms for each gene (the wild type [left two bars] and the FNR strain [right two bars] under aerobic and anaerobic conditions, respectively). Any member of a known or predicted polycistronic operon that meets our criteria for differential expression is indicated in bold. The whole operon is shown for comparison. FNR binding sites in the upstream region of a gene are represented by a bar (solid, documented; open, predicted). The italicized number above the box is the ScanAce quality score for each FNR site; the number below is the distance from the FNR site to the transcriptional start site. Black arrows indicate the position and the orientation of transcriptional start sites of each operon either documented or predicted by RegulonDB or by Bockhorst et al. (8). Tick bars are spaced at 100-bp intervals. Error bars represent standard deviations of results from three replicates.
FIG. 3.
FIG. 3.
In vivo expression of selected promoters. FNR+ or FNR strains carrying promoter-lacZ fusions in single copy were grown anaerobically and assayed for β-Gal. The activities shown are the averages of results from two independent determinations. The promoters of the genes analyzed are indicated on the x axis. A promoterless lacZ fusion produced 7 U of activity.
FIG. 4.
FIG. 4.
In vitro transcription assays of selected promoters. Autoradiograph of RNA transcripts generated from plasmid templates carrying the ynfE, ydjX, ydhY, and ydfZ promoters. Incubations containing FNR are indicated, and the RNA-1 transcript serves as an internal control. Transcripts that appeared to be regulated directly by FNR are marked (•).

Similar articles

Cited by

References

    1. Alexeeva, S., B. de Kort, G. Sawers, K. J. Hellingwerf, and M. J. de Mattos. 2000. Effects of limited aeration and of the ArcAB system on intermediary pyruvate catabolism in Escherichia coli. J. Bacteriol. 182:4934-4940. - PMC - PubMed
    1. Andrews, J. C., and S. A. Short. 1986. opp-lac operon fusions and transcriptional regulation of the Escherichia coli trp-linked oligopeptide permease. J. Bacteriol. 165:434-442. - PMC - PubMed
    1. Bhriain, N. N., C. J. Dorman, and C. F. Higgins. 1989. An overlap between osmotic and anaerobic stress responses: a potential role for DNA supercoiling in the coordinate regulation of gene expression. Mol. Microbiol. 3:933-942. - PubMed
    1. Bilous, P. T., S. T. Cole, W. F. Anderson, and J. H. Weiner. 1988. Nucleotide sequence of the dmsABC operon encoding the anaerobic dimethylsulphoxide reductase of Escherichia coli. Mol. Microbiol. 2:785-795. - PubMed
    1. Birkmann, A., F. Zinoni, G. Sawers, and A. Bock. 1987. Factors affecting transcriptional regulation of the formate-hydrogen-lyase pathway of Escherichia coli. Arch. Microbiol. 148:44-51. - PubMed

Publication types

MeSH terms

LinkOut - more resources