. 2005 Feb 9;24(3):499-509.
doi: 10.1038/sj.emboj.7600557. Epub 2005 Jan 20.

Evidence for a single heptahelical domain being turned on upon activation of a dimeric GPCR

Affiliations

Evidence for a single heptahelical domain being turned on upon activation of a dimeric GPCR

Veronika Hlavackova et al. EMBO J. .

Abstract

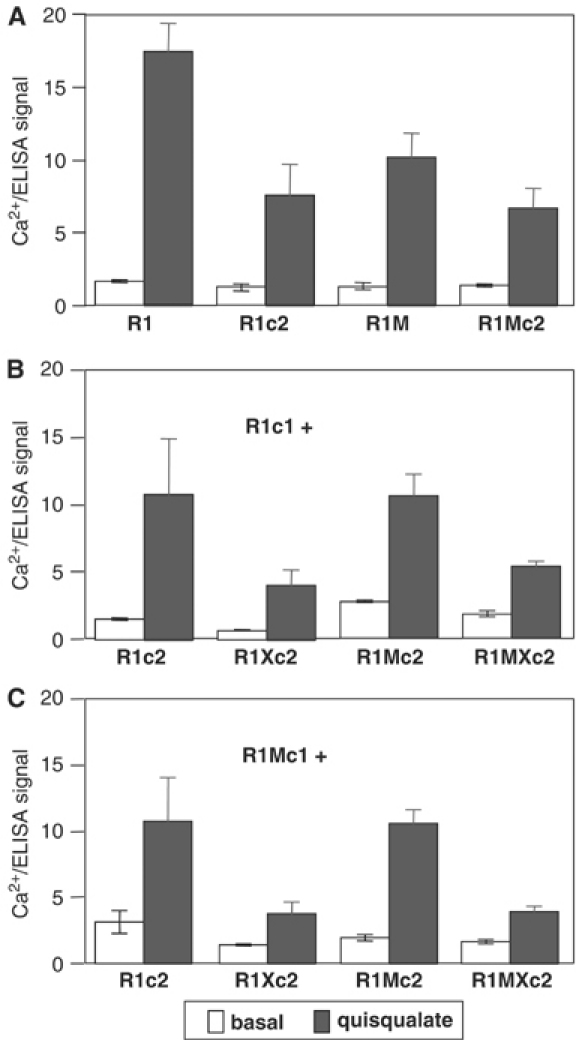
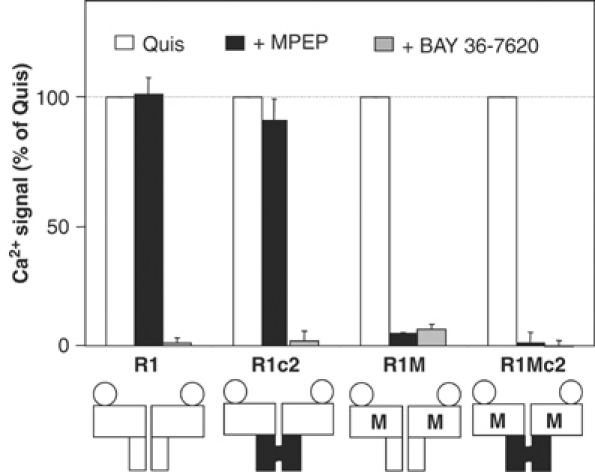
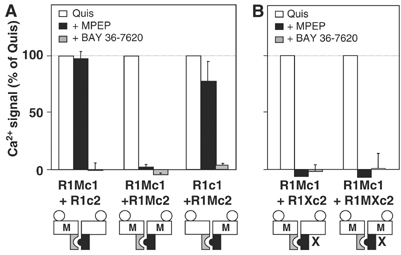
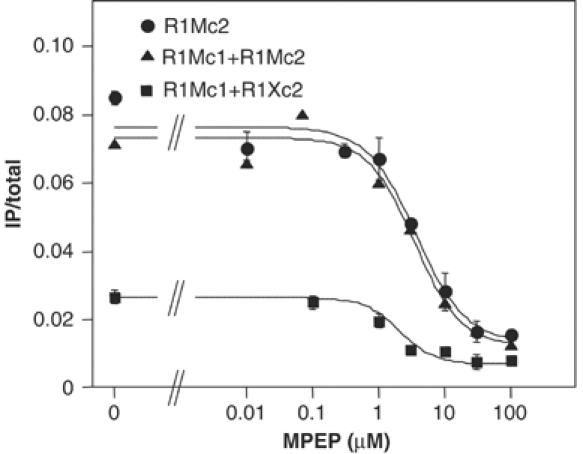
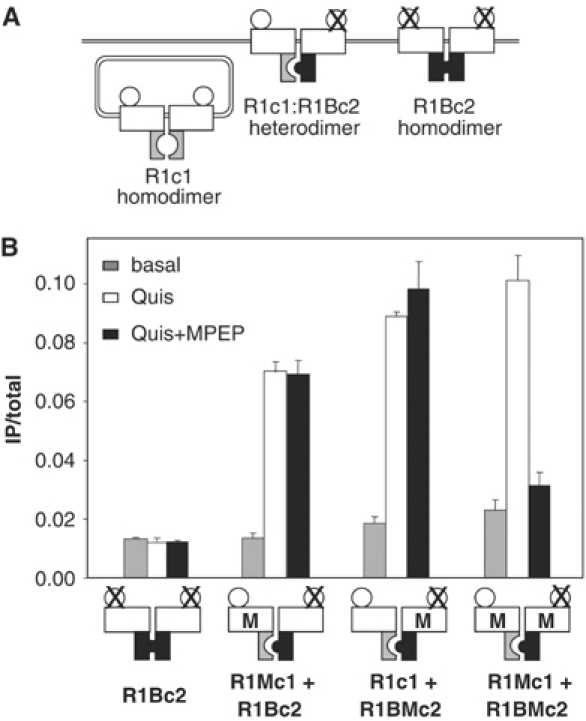
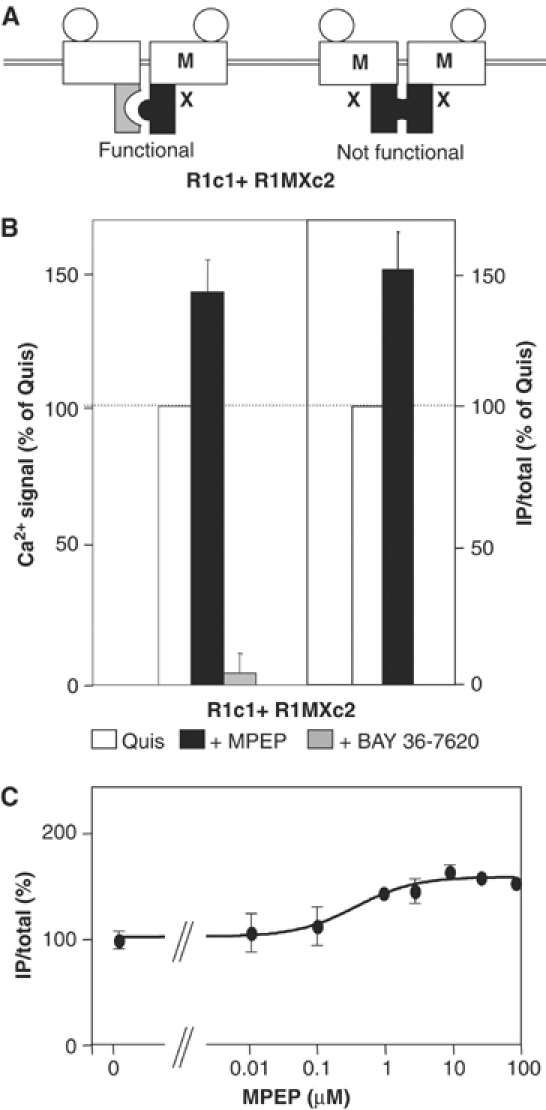
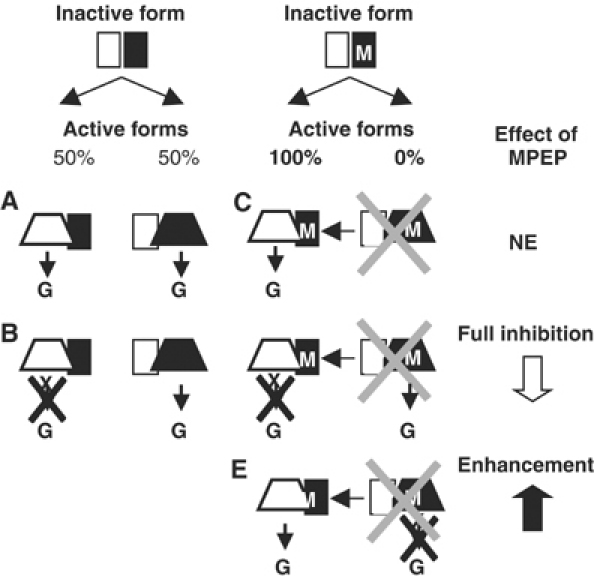
G-protein-coupled receptors (GPCRs) have been shown to form dimers, but the relevance of this phenomenon in G-protein activation is not known. Among the large GPCR family, metabotropic glutamate (mGlu) receptors are constitutive dimers. Here we examined whether both heptahelical domains (HDs) are turned on upon full receptor activation. To that aim, we measured G-protein coupling efficacy of dimeric mGlu receptors in which one subunit bears specific mutations. We show that a mutation in the third intracellular loop (i3 loop) known to prevent G-protein activation in a single subunit decreases coupling efficacy. However, when a single HD is blocked in its inactive state using an inverse agonist, 2-methyl-6-(phenylethynyl)pyridine (MPEP), no decrease in receptor activity is observed. Interestingly, in a receptor dimer in which the subunit that binds MPEP is mutated in its i3 loop, MPEP enhances agonist-induced activity, reflecting a 'better' activation of the adjacent HD. These data are consistent with a model in which a single HD is turned on upon activation of such homodimeric receptors and raise important issues in deciphering the functional role of GPCR dimer formation for G-protein activation.


Figures

Figure 1
Figure 1
Determination of cell surface expression of GABAB and wild-type or chimeric mGlu1 receptors. ELISA assay was conducted on intact cells (control, black columns) or on cells permeabilized with Triton X-100 (white columns) using an HA antibody. HA-tagged GB1, mGlu1 (R1), R1c1 or R1c2 was transfected alone or together with myc-tagged GB2 or R1c2, as illustrated in the figure. Mock represents the signal obtained with pRK6-transfected cells. Values are means±s.e.m. of triplicate determinations from one representative experiment out of three independent experiments.
Figure 2
Figure 2
Heterodimerization of chimeric mG1 receptor subunits. (A) The TR-FRET signal was measured using anti-HA-EuCryptate and anti-myc-Alexa647 antibodies using intact cells expressing the indicated subunits. (B) The specific fluorescent signal (signal measured in the indicated cells minus the signal measured in mock-transfected cells) was measured with the anti-HA-EuCryptate antibody, and is used here to estimate the level of surface expression of the HA-tagged subunits. (C) Same as in (B) with the anti-myc-Alexa647 antibody to estimate the surface expression of the myc-tagged subunits. (D) Same as in (A) but using an equimolar amount of anti-HA-EuCryptate and anti-HA-Alexa647 to visualize any possible interaction between the HA-tagged subunits. (E) The TR-FRET signal was measured in cells transfected with 1 μg HA-R1c1 and various amounts of myc-R1c2 (0–1 μg). Anti-HA-EuCryptate and anti-myc-Alexa647 antibodies were used to estimate HA-R1c1:myc-R1c2 heterodimers (open circles), while anti-HA-EuCryptate and anti-HA-Alexa647 antibodies were used to estimate the amount of HA-R1c1:HA-R1c1 homodimers (closed circles). The plot shows the TR-FRET signal as a function of the surface expression of the HA-tagged subunits as determined by the specifically bound anti-HA-EuCryptate antibody. All values are means±s.e.m. of triplicate determinations from a representative experiment out of three. Data shown in (A–D) are from a single experiment.
Figure 3
Figure 3
Quantification of the relative expression of R1c1:R1c2 heterodimers and R1c2:R1c2 homodimers by ELISA on intact cells. (A) Schematic representation of the expected surface expression of the chimeric receptors. Mb: plasma membrane; ER: endoplasmic reticulum; HA indicates that the subunit is HA-tagged; (HA) means that this subunit is either HA-tagged or not, as indicated in (B). (B) Determination of the luminescence signal obtained by ELISA using HA antibody measured in cells expressing the indicated subunits, of which one or both are HA-tagged. Values are means±s.e.m. of triplicate determinations from a typical experiment out of three and correspond to the raw values obtained with the luminometer.
Figure 4
Figure 4
Effect of increasing doses of quisqualate on mutated mGlu1 receptors. Increase in Ca2+ (A) or IP formation (B) in cells expressing the indicated receptor subunits is plotted as a function of quisqualate concentration. Values are normalized to the quisqualate-evoked maximal response obtained with wild-type mGlu1 receptor (100%) and are means±s.e.m. of at least three independent experiments performed in triplicate.
Figure 5
Figure 5
Effect of F781P point mutation within the i3 loop on quisqualate-evoked Ca2+ signal in cells expressing various types of receptor dimer combinations. (A) Response measured in cells expressing wild-type, chimeric or M-mutated receptors alone. (B) Response measured in cells coexpressing R1c1 and the indicated R1c2 constructs. (C) Response measured in cells coexpressing R1Mc1 and the indicated R1c2 constructs. In each case, basal (open columns) and quisqualate-induced (gray columns) responses were determined. For each individual experiment, both the Ca2+ signal and surface expression of the HA-tagged subunit were measured. Values are means±s.e.m. of the Ca2+ signal over the ELISA signals of 3–4 independent experiments performed in triplicate.
Figure 6
Figure 6
Effect of MPEP and BAY 36-7620 on quisqualate-evoked Ca2+ signal on wild-type, R1c2, R1M and R1Mc2 homodimers. Effect of quisqualate (1 μM) alone (open columns) or together with MPEP (100 μM) (black columns) or BAY 36-7620 (10 μM) (gray columns) on Ca2+ signals was measured in cells expressing the indicated subunits. Values are expressed as percentage of the maximal quisqualate effect and are mean±s.e.m. of three independent experiments performed in triplicate.
Figure 7
Figure 7
Two MPEP sites per dimer appear necessary for MPEP inhibition of receptor activity. Effect of quisqualate (1 μM) alone (open columns) or together with MPEP (100 μM) (black columns) or BAY 36-7620 (10 μM) (gray columns) on Ca2+ signals was measured in cells expressing the indicated subunits. Values are expressed as a percentage of the maximal quisqualate effect and are means±s.e.m. of three independent experiments performed in triplicate.
Figure 8
Figure 8
Dose-dependent effect of MPEP on the quisqualate-stimulated IP production. HEK293 expressing R1Mc2 (circles) or coexpressing R1Mc1 with R1Mc2 (triangles) and R1Mc1:R1Xc2 (squares) were monitored for changes in IP formation upon stimulation with quisqualate (1 μM) in the presence of various concentrations of MPEP. Results are expressed as IP production over the total radioactivity remaining in the membrane fraction of the cells. Values are means±s.e.m. of triplicate determinations from a representative experiment out of three independent experiments.
Figure 9
Figure 9
MPEP does not inhibit activity of receptor dimers containing a single MPEP site. (A) Scheme illustrating that in cells expressing R1c1 and R1Bc2, the R1c1 homodimer is retained in the ER and the R1Bc2 homodimer is not functional due to the agonist site mutations, such that only the R1c1:R1Bc2 combination is functional. (B) IP production measured under basal condition (gray columns), in the presence of quisqualate (white columns) or in the presence of both quisqualate and MPEP (black columns) in cells expressing the indicated combinations of subunits. Data are means±s.e.m. of triplicate determinations from a representative experiment out of five.
Figure 10
Figure 10
MPEP enhances quisqualate-induced responses in cells expressing R1c1 and R1MXc2. (A) Schematic representation of the expected receptor dimers at the surface of cells expressing both R1c1 and R1MXc2 subunits. Note that only the heteromer can generate a signal upon agonist activation. (B) The Ca2+ signal (left panel) and IP production (right panel) induced by quisqualate alone (open columns) or together with MPEP (black columns) or BAY 36-7620 (gray columns) were measured in cells expressing the indicated subunits. (C) Effect of increasing concentrations of MPEP on IP production induced by quisqualate in cells expressing R1c1 and R1MXc2. Values are expressed as a percentage of the maximal quisqualate effect and are means±s.e.m. of 3–7 independent experiments performed in triplicate.
Figure 11
Figure 11
Proposed model: one HD being turned on at a time. The receptor is represented as a dimer of HDs, one in white and the other in black. The inactive conformation of the HD is represented by a rectangle, whereas the active form is represented by a trapezoid. The presence of the i3 loop mutation that prevents G-protein activation is indicated by a star. The presence of an MPEP site is indicated by an M. The expected effect of MPEP, according to our model proposing that only one HD can reach the active state at a time, is indicated on the right. (A) Control condition, with either HD being turned on. (B) One HD is mutated in its i3 loop such that only 50% of the dimers activate the G-protein. (C) When MPEP prevents the black HD from reaching the active state, then only the white HD is turned on in every receptor dimer. (D) MPEP fully blocks receptor dimer activity when bound to the only active subunit. (E) By preventing the black HD from reaching its active state, MPEP increases the probability of the white HD to be turned on, thus leading to an enhancement of the agonist effect. NE: no effect.

References

    1. Angers S, Salahpour A, Bouvier M (2002) Dimerization: an emerging concept for G protein-coupled receptor ontogeny and function. Annu Rev Pharmacol Toxicol 42: 409–435 - PubMed
    1. Ango F, Pin J-P, Tu JC, Xiao B, Worley PF, Bockaert J, Fagni L (2000) Dendritic and axonal targeting of type 5 metabotropic glutamate receptor (mGluR5) is regulated by homer1 proteins and neuronal excitation. J Neurosci 20: 8710–9716 - PMC - PubMed
    1. Balasubramanian S, Teissere JA, Raju DV, Hall RA (2004) Hetero-oligomerization between GABAA and GABAB receptors regulates GABAB receptor trafficking. J Biol Chem 279: 18840–18850 - PubMed
    1. Baneres J-L, Parello J (2003) Structure-based analysis of GPCR function. Evidence for a novel pentameric assembly between the dimeric leukotriene B4 receptor BLT1 and the G-protein. J Mol Biol 329: 815–829 - PubMed
    1. Bessis A-S, Rondard P, Gaven F, Brabet I, Triballeau N, Prézeau L, Acher F, Pin J-P (2002) Closure of the Venus Flytrap module of mGlu8 receptor and the activation process: insights from mutations converting antagonists into agonists. Proc Natl Acad Sci USA 99: 11097–11102 - PMC - PubMed

Publication types

MeSH terms

Substances