Comparative Study
. 2005 Jan;3(1):e10.
doi: 10.1371/journal.pbio.0030010. Epub 2005 Jan 4.

A model of the statistical power of comparative genome sequence analysis

Affiliations
Comparative Study

A model of the statistical power of comparative genome sequence analysis

Sean R Eddy. PLoS Biol. 2005 Jan.

Abstract

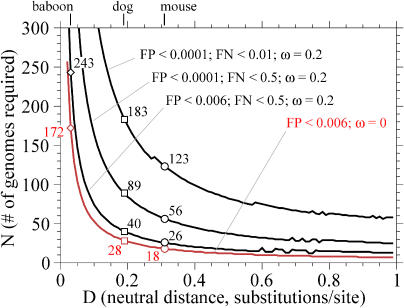
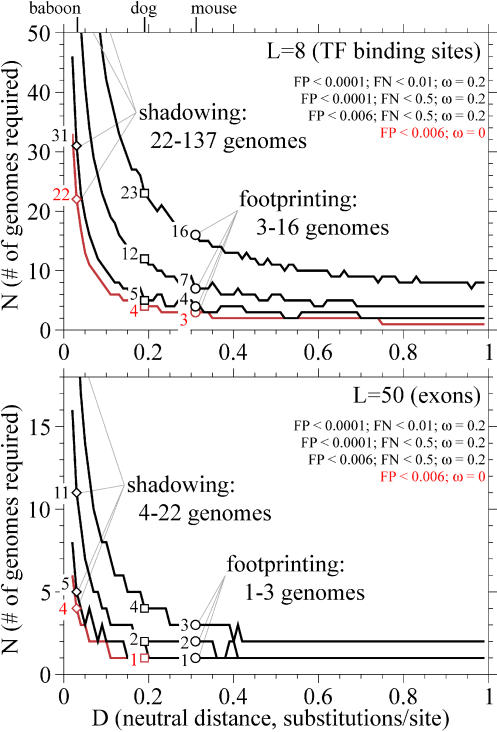
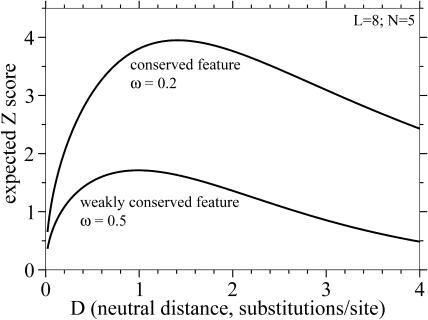
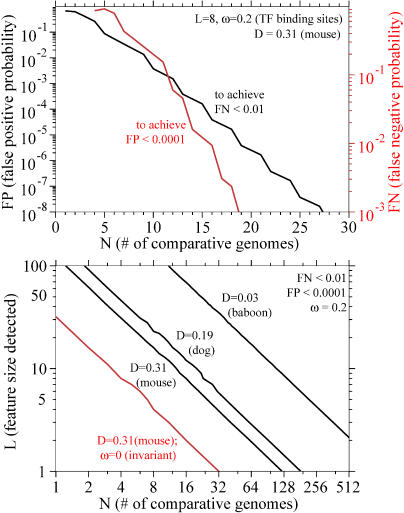
Comparative genome sequence analysis is powerful, but sequencing genomes is expensive. It is desirable to be able to predict how many genomes are needed for comparative genomics, and at what evolutionary distances. Here I describe a simple mathematical model for the common problem of identifying conserved sequences. The model leads to some useful rules of thumb. For a given evolutionary distance, the number of comparative genomes needed for a constant level of statistical stringency in identifying conserved regions scales inversely with the size of the conserved feature to be detected. At short evolutionary distances, the number of comparative genomes required also scales inversely with distance. These scaling behaviors provide some intuition for future comparative genome sequencing needs, such as the proposed use of "phylogenetic shadowing" methods using closely related comparative genomes, and the feasibility of high-resolution detection of small conserved features.


Figures

Figure 1
Figure 1. Number of Genomes Required for Single Nucleotide Resolution
The red line plots genome number required for identifying invariant sites (ω = 0) with a FP of 0.006, essentially corresponding to the Cooper model [7]. Black lines show three more parameter sets: identifying 50% (FN < 0.5) of conserved sites evolving 5-fold slower than neutral (ω = 0.2) with FP < 0.006, doing likewise but with a more-stringent FP of 0.0001, and identifying 99% of conserved sites instead of just half of them. Values of N at baboon-like, dog-like, and mouse-like neutral distances are indicated with diamonds, squares, and circles, respectively. Jaggedness of the lines here and in subsequent figures is an artifact of using discrete N, L, and cutoff threshold C to satisfy continuous FP and FN thresholds.
Figure 2
Figure 2. Number of Genomes Required for 8-nt or 50-nt Resolution
Top: identifying 8-nt conserved features (“transcription factor binding sites”; L = 8); bottom: identifying 50-nt conserved features (“exons”; L = 50). Parameter settings are indicated at top right, in same order as the plotted lines. The parameters are the same as those used in Figure 1.
Figure 3
Figure 3. A Measure of Statistical Strength As a Function of Neutral Evolutionary Distance
One convenient threshold-independent measure of the strength of a comparative analysis is an expected Z score, the expected difference Δc in the number of substitutions in a neutral feature alignment versus a conserved feature alignment, normalized to units of standard deviations. E(Z) is readily calculated for the binomial distribution: where pn and pc are the probabilities of observing a change at one aligned comparative nucleotide according to the Jukes-Cantor equation. The plots here are for N = 5 and L = 8. The shape of the curve is independent of N and L, while the absolute magnitude of Z scales as NL . The x-axis is shown from D = 0 to D = 4, beyond the more realistic range of Figures 1 and 2, to show the mathematically optimum D if homologous conserved features were present, recognized, and accurately aligned at any D.
Figure 4
Figure 4. Increase in Stringency and Resolution with Increasing Genome Number
Top: black line shows improvement in specificity (FP) for transcription factor (TF) binding site–like features (L = 8, ω = 0.2) as comparative genome number increases, for FN = 0.01 (99% of sites detected), and genomes of D = 0.31 (mouse/human-like distance). Red line shows improvement in sensitivity (FN) for the same parameters and a FP threshold of 0.0001. Shown as a log-linear plot to show the expected rough log(FP or FN) proportional to −N scaling. Bottom: resolution (size of detectable feature, L) as a function of comparative genome number, plotted on log-log axes to show the fit to the expected L ∝ 1/N scaling. All four lines assume goals of FN < 0.01 and FP < 0.0001. Black lines are for identifying conserved features evolving 5-fold slower than neutral (ω = 0.2), using baboon-like (D = 0.03), dog-like (D = 0.19), or mouse-like (D = 0.31) genomes. Red line is for identifying invariant features with mouse-like genomes.

Similar articles

Cited by

References

    1. Hardison RC. Conserved noncoding sequences are reliable guides to regulatory elements. Trends Genet. 2000;16:369–372. - PubMed
    1. Sidow A. Sequence first. Ask questions later. Cell. 2002;111:13–16. - PubMed
    1. Hardison RC. Comparative genomics. PLoS Biol. 2003;1:e58. - PMC - PubMed
    1. Thomas JW, Touchman JW, Blakesley RW, Bouffard GG, Beckstrom-Sternberg SM, et al. Comparative analyses of multi-species sequences from targeted genomic regions. Nature. 2003;424:788–793. - PubMed
    1. Cliften PF, Hillier LW, Fulton L, Graves T, Miner T, et al. Surveying Saccharomyces genomes to identify functional elements by comparative DNA sequence analysis. Genome Res. 2001;11:1175–1186. - PubMed

Publication types