. 2005 Jan;3(1):e17.
doi: 10.1371/journal.pbio.0030017. Epub 2005 Jan 11.

Neuronal encoding of texture in the whisker sensory pathway

Affiliations

Neuronal encoding of texture in the whisker sensory pathway

Ehsan Arabzadeh et al. PLoS Biol. 2005 Jan.

Abstract

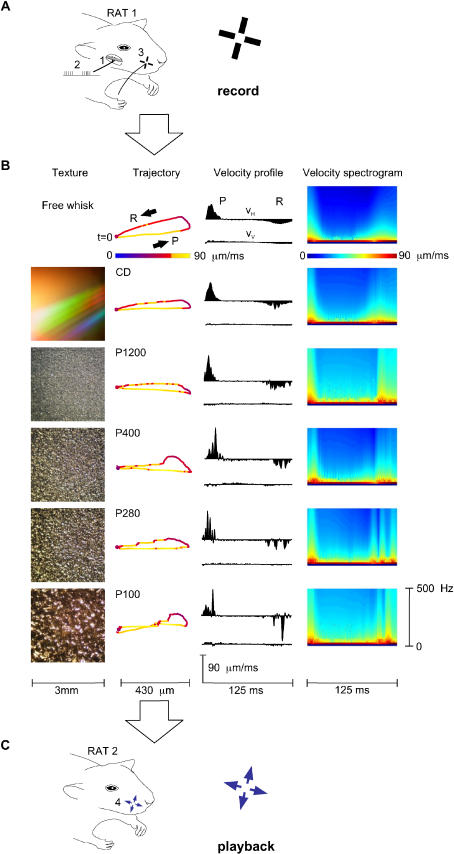
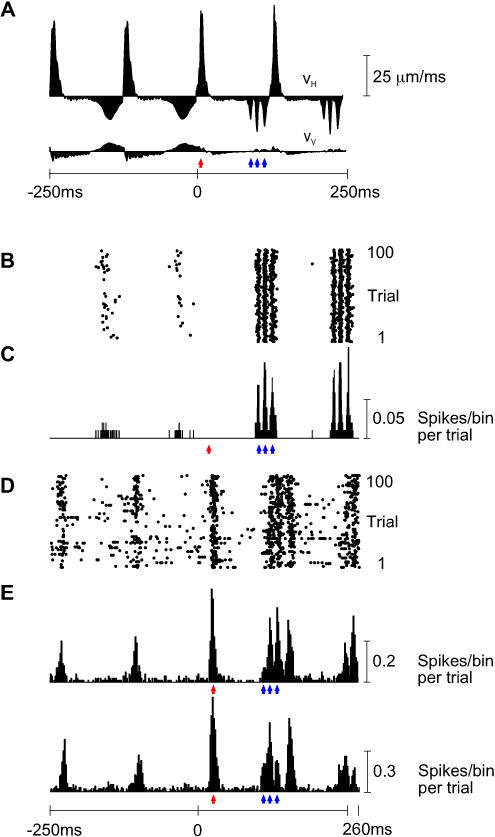
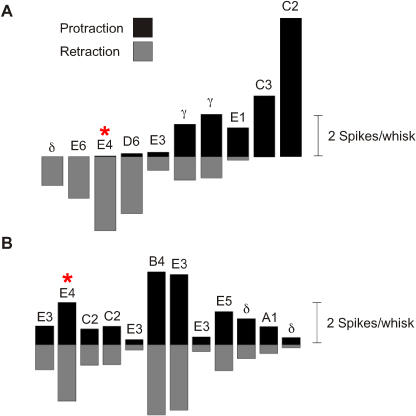
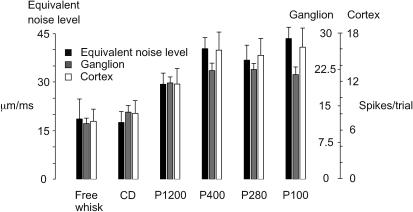
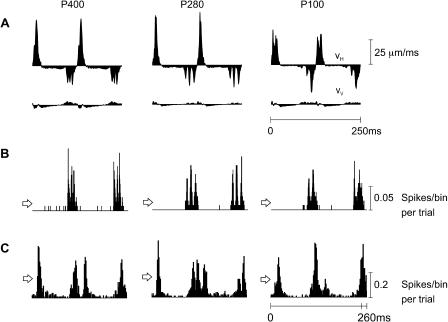
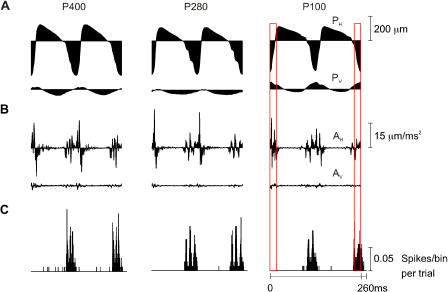
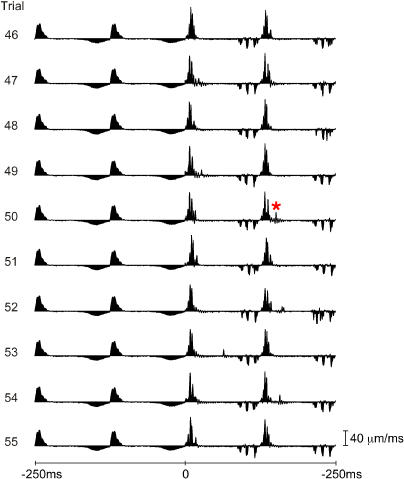
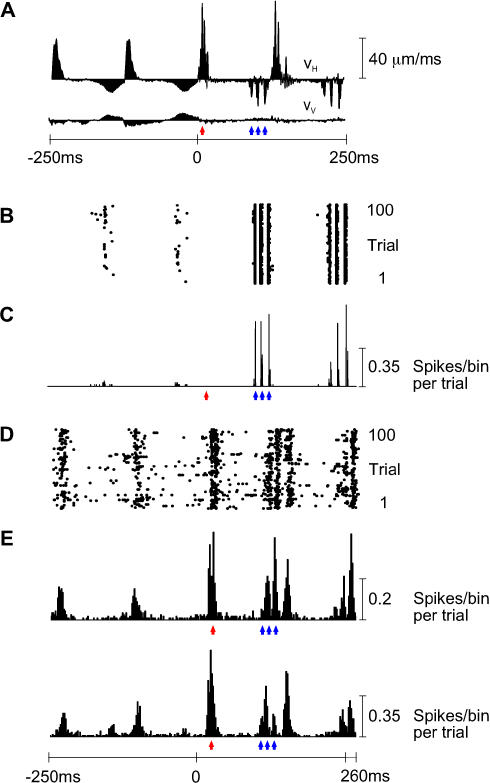
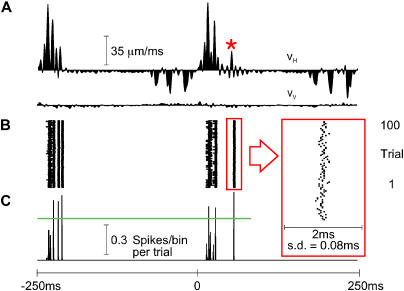
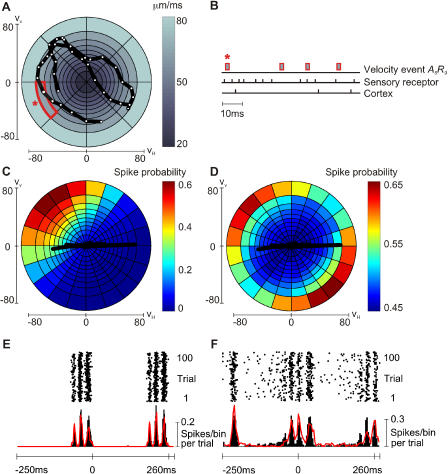
A major challenge of sensory systems neuroscience is to quantify brain activity underlying perceptual experiences and to explain this activity as the outcome of elemental neuronal response properties. Rats make extremely fine discriminations of texture by "whisking" their vibrissae across an object's surface, yet the neuronal coding underlying texture sensations remains unknown. Measuring whisker vibrations during active whisking across surfaces, we found that each texture results in a unique "kinetic signature" defined by the temporal profile of whisker velocity. We presented these texture-induced vibrations as stimuli while recording responses of first-order sensory neurons and neurons in the whisker area of cerebral cortex. Each texture is encoded by a distinctive, temporally precise firing pattern. To look for the neuronal coding properties that give rise to texture-specific firing patterns, we delivered horizontal and vertical whisker movements that varied randomly in time ("white noise") and found that the response probabilities of first-order neurons and cortical neurons vary systematically according to whisker speed and direction. We applied the velocity-tuned spike probabilities derived from white noise to the sequence of velocity features in the texture to construct a simulated texture response. The close match between the simulated and real responses indicates that texture coding originates in the selectivity of neurons to elemental kinetic events.


Figures

Figure 1
Figure 1. Collection and Playback of Texture Library
(A) Whisker vibration data were collected during “electrical whisking,” induced by stimulation of the facial nerve (1) with pulse trains (2) in rat EW3. An optical sensor, shown schematically by two orthogonal light paths (3), monitored vertical and horizontal whisker motion of whisker C3. (B) “Texture” column: Photographs of the 5 surfaces used. “Trajectory” column: Sample whisker trajectories (first whisk of trial 50) associated with free whisking and the five surfaces. Each point, separated by 1 ms, gives the horizontal and vertical position; the trajectory begins with protraction (P) at t = 0 and terminates 125 ms later at the end of retraction (R). Speed is given by the color of each point. Note the irregularities—jumps, stops, and starts—induced by whisking on sandpaper. “Velocity profile” column: Whisker trajectories displayed according to the horizontal and vertical velocities (VH and VV, respectively). P refers to protraction phase (positive VH), and R to retraction phase (negative VH). In this and all figures, VH and VV were calculated 7,634 times per second. “Velocity spectrogram” column: Velocity spectrograms for each texture (see Materials and Methods). (C) Playback of the whisker trajectories to a second group of rats through a piezoelectric motor (4), shown schematically by the horizontal and vertical arrows at the base of the whisker.
Figure 2
Figure 2. Sensory Receptor and Cortical Coding Properties
(A) VH and VV for two free whisks followed by two P280 whisks. The labeling conventions are as in Figure 1B. Each presented trial was unique due to small variations in whisker trajectory even on the same surface (Figure 7); the illustrated velocity profiles are the averages of 100 trials. The red arrowhead indicates the time of the first VH peak during whisker protraction on P280; blue arrowheads indicate the times of the three VH peaks during whisker retraction on P280. (B) Raster plot of first-order neuron aligned with the whisker trajectories, in response to 100 unique trials. Stimuli were applied to whisker E4. (C) PSTH of first-order neuron with 0.2-ms bins. Blue arrowheads indicate the times of maximum response to the three peaks in retraction velocity. The red arrowhead indicates the expected time of response to the peak in protraction velocity; however, the neuron did not respond to whisker protraction. (D) Raster plot for the cortical neuron cluster recorded simultaneously with the first-order neuron. (E) Two cortical PSTHs, both with 2-ms bins. The upper PSTH corresponds to the raster plot in (D); the lower PSTH is from a second cortical neuron cluster recorded simultaneously at a neighboring electrode (distance 560 μm). Blue and red arrowheads indicate the times of maximum response to the peaks in whisker protraction and retraction velocity, carried down from (A). The cortical neuron clusters responded to high velocities for both protraction and retraction. Because the first two peaks in retraction velocity were separated by just 7 ms, the resulting peaks in cortical response were fused. All PSTHs are extended to 260 ms to show responses to the final velocity feature.
Figure 3
Figure 3. Directional Selectivity in First-Order and Cortical Neurons
(A) Mean spike count per whisk for ten first-order neurons separated into protraction and retraction phases. Responses to free-whisk and all textures were combined, giving a total of 8,000 whisks. First-order neurons are arranged from left to right according to their retraction:protraction spike count ratio. Five first-order neurons preferred retraction, three preferred retraction, and two responded to both phases. Principal whisker of each neuron is indicated. The neuron Zurvan is indicated by an asterisk. (B) Same analysis for 12 cortical clusters. Individual cortical neuron clusters did not present a clear preference for either retraction or protraction. Conclusions about single unit directional selectivity cannot be drawn, however, because the directional selectivity of any cluster must always be less than that of the most selective single unit in the cluster. The neuron cluster (Figure 2D, 2E) recorded simultaneously with Zurvan is indicated by an asterisk.
Figure 4
Figure 4. Texture Coding by Firing Rate
Equivalent noise level (plus SD) of texture-induced vibrations averaged across 100 trials of 500 ms each (see Materials and Methods). Average spike count per trial (plus SD) pooled from ten first-order neurons and 12 cortical neuron clusters. Note separate scales for spike counts of neurons recorded in Ganglion and Cortex.
Figure 5
Figure 5. Texture Coding by Firing Patterns
(A) VH and VV for two whisks on texture P400 (left), P280 (middle), and P100 (right). Each illustrated velocity profile is the average of 100 unique profiles. (B) First-order neuron PSTHs (0.2-ms bins) aligned with the whisker trajectories. (C) Cortical PSTHs (2-ms bins). PSTHs are extended to 260 ms. The arrowheads on the left side of PSTHs indicate mean firing rates.
Figure 6
Figure 6. Test for First-Order Neuron Encoding of Position and Acceleration
To investigate whether first-order neurons represented stimulus features other than velocity, we repeated the same analysis as in Figure 5, in relation to whisker position (A) and acceleration (B), because it has been suggested that neuronal activity is determined by these stimulus parameters [10,13]. Alignment between the PSTH (C) and stimulus position or acceleration revealed no consistent correlation. For texture P100, the boxes extending across A, B, and C highlight the absence of correlation. For example, two periods with similar positions produced first no spikes (red-outlined box on left) and then a large response (red-outlined box on right). Moreover, high acceleration (left box) produced no spikes, while lower levels of acceleration (right box) produced a large response. For this neuron, only velocity was encoded.
Figure 7
Figure 7. Velocity Profile Variability across Trials
Ten successive trials are shown (numbers 46–55), each trial composed of the final two free-whisks (–250 to 0 ms) and the first two whisks on P280 (0 to 250 ms). Free whisk velocity profiles varied little across trials. When the whisker swept across P280 repeatedly, the fundamental kinetic signature was conserved (e.g., the three peaks in retraction velocity for P280) but minute details of the profile varied—note, for example, the velocity event (red asterisk) that occurred uniquely on trial 50.
Figure 8
Figure 8. Sources of Neuronal Variability
(A) VH and VV across the final two free whisks and the first two P280 whisks of trial number 50. Here, as in Figure 2, the red arrowhead indicates peak whisker velocity during protraction, and blue arrowheads indicate the peak whisker velocities during retraction. (B and C) First-order neuron raster plot (B) and PSTH (C), aligned with the whisker trajectories, for 100 stimulus repetitions. Due to the temporal precision of neuronal responses, the vertical scale of the PSTH has been altered (compare to Figures 2 and 5) to reflect the large numbers of spikes within single bins. (D) Cortical neuron cluster raster plot. (E) Two cortical PSTHs from activity recorded simultaneously with the first-order neuron. The upper PSTH corresponds to the raster plot in (D); the lower PSTH is derived from a second cortical neuron cluster recorded simultaneously at a neighboring electrode (distance of 560 μm). PSTHs have 0.2-ms bins for the first-order neuron and 2-ms bins for the cortical neuron clusters. All PSTHs are extended to 260 ms to show responses to the final velocity feature. Response peaks are signaled by red and blue arrowheads according to the velocity events that evoked them.
Figure 9
Figure 9. Precision of a First-Order Neuron
(A) VH and VV across the first two P280 whisks of trial number 50 (see Figure 7). (B and C) Raster plot (B) and PSTH (C) of the first-order neuron for 100 repetitions of the stimulus given in (A). Inset in red frame shows a magnified view of spikes emitted in response to a single velocity event (red asterisk in [A]) and their SD in time. The same measurement of jitter was carried out for each of the response peaks that surpassed the green horizontal line (see text).
Figure 10
Figure 10. Velocity Tuning Curves and Simulated Texture Responses
(A) A 5-ms trajectory of velocity white noise. Radial coordinates give VH, VV. Velocity space was subdivided such that each segment included the same number of events (3,435,300). One segment (red outline) is selected for further explanation (see text). (B) 100-ms ganglion and cortical spike train aligned below occurrences of the velocity event of interest (red bar). After each such event, spike times were accumulated to build up a spike probability profile. (C) First-order neuron spike probabilities, given by color scale, in relation to joint A,R events. To estimate the tuning curve in finer detail, the number of angles was increased to 20. Each segment now contains about 1,374,120 velocity events. One P280 whisk trajectory is superimposed. (D) Spike probabilities for cortical neuron cluster, given by color scale, in relation to joint A,R events. One P280 whisk trajectory is superimposed. (E) Simulated raster plot for first-order neuron and simulated (black) and real (red) PSTHs. (F) Simulated raster plot for cortical neuron cluster and simulated (black) and real (red) PSTHs.

Similar articles

Cited by

References

    1. Carvell GE, Simons DJ. Biometric analyses of vibrissal tactile discrimination in the rat. J Neurosci. 1990;10:2638–2648. - PMC - PubMed
    1. Gamzu E, Ahissar E. Importance of temporal cues for tactile spatial-frequency discrimination. J. Neurosci. 2001;21:7416–7427. - PMC - PubMed
    1. Sachdev RN, Sellien H, Ebner F. Temporal organization of multi-whisker contact in rats. Somatosens Mot Res. 2001;18:91–100. - PubMed
    1. Bermejo R, Vyas A, Zeigler HP. Topography of rodent whisking - I. Two-dimensional monitoring of whisker movements. Somatosens Mot Res. 2002;19:341–346. - PubMed
    1. Berg RW, Kleinfeld D. Rhythmic whisking by rat: Retraction as well as protraction of the vibrissae is under active muscular control. J Neurophysiol. 2003;89:104–117. - PubMed

Publication types