

Apparent diffusion coefficients in spinal cord transplants and surrounding white matter correlate with degree of axonal dieback after injury in rats
- PMID: 15661691
- PMCID: PMC7975021
Apparent diffusion coefficients in spinal cord transplants and surrounding white matter correlate with degree of axonal dieback after injury in rats
Abstract
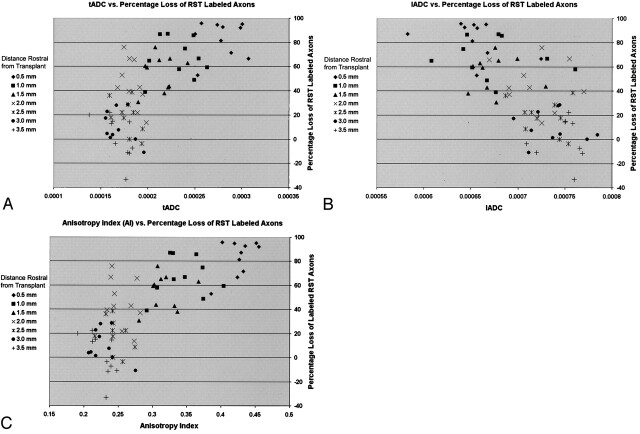
Background and purpose: Abnormal apparent diffusion coefficient (ADC) values in injured spinal cord white matter and fibroblast transplants have been shown to correspond with qualitative histologic findings of axonal loss or regeneration. We proposed that ADC values would correlate with quantitative axonal tracing in the transected rubrospinal tract (RST).
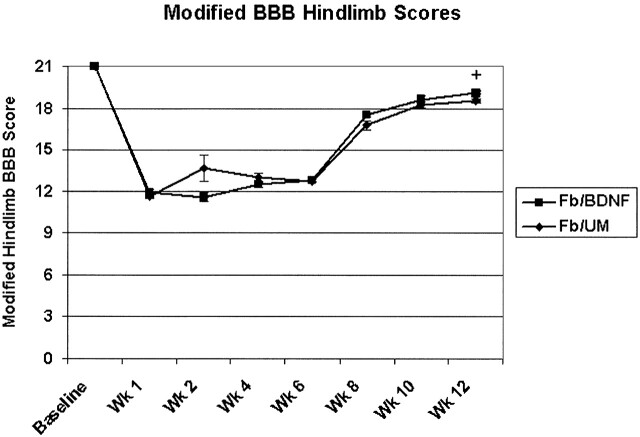
Methods: Eleven rats received right-sided lateral funiculus lesions at C3-4 (disrupting the RST) and transplantation of fibroblasts that were unmodified or modified to secrete brain-derived neurotrophic factor (BDNF). Behavioral tests measured hindlimb function at 1, 2, 4, 6, 8, 10, and 12 weeks after injury. At 12 weeks after injury, the antegrade axon tracer biotinylated dextran amine was stereotactically injected into the red nucleus to label the injured RST axons. Animals were sacrificed 2 weeks later. Diffusion-weighted MR imaging of the excised, fixed spinal cord specimens was then performed at 9.4 T.
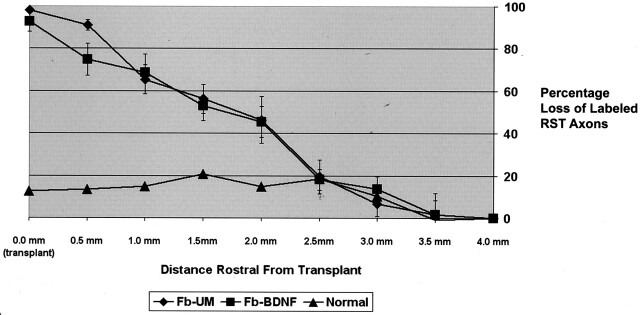
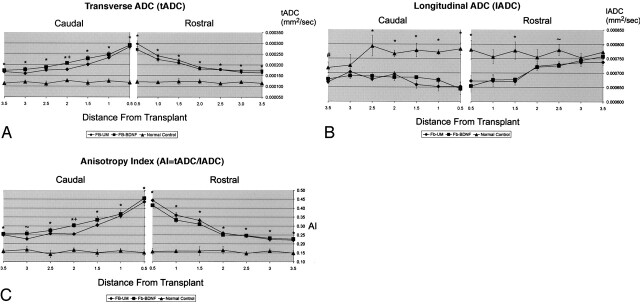
Results: In white matter surrounding transplants, ADC values transverse to axons were elevated and ADC values longitudinal to axons were decreased. These ADC values were more abnormal closer to the transplant, and this correlated with decreases in numbers of labeled RST axons. ADC values in BDNF-expressing fibroblast transplants were significantly lower than those in unmodified fibroblast transplants, and these lower values correlated with decreased axonal dieback. Behaviorally, all animals showed partial recovery, but animals with BDNF-expressing fibroblast transplants had slightly improved hindlimb function compared to those with unmodified fibroblast transplants.
Conclusion: ADC values may be able to evaluate graft function after spinal cord injury by demonstrating the degree of axonal dieback and preservation.
Figures
Similar articles
-
Ex vivo MR determined apparent diffusion coefficients correlate with motor recovery mediated by intraspinal transplants of fibroblasts genetically modified to express BDNF.Exp Neurol. 2003 Jul;182(1):49-63. doi: 10.1016/s0014-4886(03)00036-0. Exp Neurol. 2003. PMID: 12821376
-
Transplants of fibroblasts genetically modified to express BDNF promote axonal regeneration from supraspinal neurons following chronic spinal cord injury.Exp Neurol. 2002 Sep;177(1):265-75. doi: 10.1006/exnr.2002.7980. Exp Neurol. 2002. PMID: 12429228
-
Delayed grafting of BDNF and NT-3 producing fibroblasts into the injured spinal cord stimulates sprouting, partially rescues axotomized red nucleus neurons from loss and atrophy, and provides limited regeneration.Exp Neurol. 2003 Nov;184(1):97-113. doi: 10.1016/s0014-4886(03)00394-7. Exp Neurol. 2003. PMID: 14637084
-
Transplants and neurotrophic factors increase regeneration and recovery of function after spinal cord injury.Prog Brain Res. 2002;137:257-73. doi: 10.1016/s0079-6123(02)37020-1. Prog Brain Res. 2002. PMID: 12440372 Review.
-
Transplantation of genetically modified cells contributes to repair and recovery from spinal injury.Brain Res Brain Res Rev. 2002 Oct;40(1-3):292-300. doi: 10.1016/s0165-0173(02)00211-4. Brain Res Brain Res Rev. 2002. PMID: 12589927 Review.
Cited by
-
Brain fiber tract plasticity in experimental spinal cord injury: diffusion tensor imaging.Exp Neurol. 2008 Jul;212(1):100-7. doi: 10.1016/j.expneurol.2008.03.018. Epub 2008 Apr 3. Exp Neurol. 2008. PMID: 18482724 Free PMC article.
-
Another barrier to regeneration in the CNS: activated macrophages induce extensive retraction of dystrophic axons through direct physical interactions.J Neurosci. 2008 Sep 17;28(38):9330-41. doi: 10.1523/JNEUROSCI.2488-08.2008. J Neurosci. 2008. PMID: 18799667 Free PMC article.
-
Axonal injury detected by in vivo diffusion tensor imaging correlates with neurological disability in a mouse model of multiple sclerosis.NMR Biomed. 2008 Jul;21(6):589-97. doi: 10.1002/nbm.1229. NMR Biomed. 2008. PMID: 18041806 Free PMC article.
-
Multiexponential T2, magnetization transfer, and quantitative histology in white matter tracts of rat spinal cord.Magn Reson Med. 2010 Apr;63(4):902-9. doi: 10.1002/mrm.22267. Magn Reson Med. 2010. PMID: 20373391 Free PMC article.
-
Diffusion tensor MR imaging in chronic spinal cord injury.AJNR Am J Neuroradiol. 2008 Nov;29(10):1976-82. doi: 10.3174/ajnr.A1272. Epub 2008 Aug 21. AJNR Am J Neuroradiol. 2008. PMID: 18719029 Free PMC article.
References
-
- Selzer ME. Promotion of axonal regeneration in the injured CNS. Lancet Neurol 2003;2:157–166 - PubMed
-
- Raineteau O, Schwab ME. Plasticity of motor systems after incomplete spinal cord injury. Nat Rev Neurosci 2001;2:263–273 - PubMed
-
- Ford JC, Hackney DB, Alsop DC, et al. MRI characterization of diffusion coefficients in a rat spinal cord injury model. Magn Reson Med 1994;31:488–494 - PubMed
-
- Schwartz ED, Shumsky JS, Wehrli S, Tessler A, Murray M, Hackney DB. Ex vivo MR determined apparent diffusion coefficients correlate with motor recovery mediated by intraspinal transplants of fibroblasts genetically modified to express BDNF. Exp Neurol 2003;182:49–63 - PubMed
-
- Nevo U, Hauben E, Yoles E, et al. Diffusion anisotropy MRI for quantitative assessment of recovery in injured rat spinal cord. Magn Reson Med 2001;45:1–9 - PubMed
Publication types
MeSH terms
Substances
Grants and funding
LinkOut - more resources
Full Text Sources
Medical
Miscellaneous