

Local tissue damage assessed with statistical mapping analysis of brain magnetization transfer ratio: relationship with functional status of patients in the earliest stage of multiple sclerosis
- PMID: 15661713
- PMCID: PMC7975013
Local tissue damage assessed with statistical mapping analysis of brain magnetization transfer ratio: relationship with functional status of patients in the earliest stage of multiple sclerosis
Erratum in
- AJNR Am J Neuroradiol. 2005 Apr;26(4):986
Abstract
Background and purpose: In the early stage of Multiple Sclerosis (MS), conventional MR imaging parameters such as T2 lesion load fail to explain the clinical status of patients. In the present work, we aimed to determine the ability of magnification transfer imaging to better reflect the relationship between local tissue damage and functional status of MS patients.
Methods: We performed a comparative statistical mapping analysis on brain tissue magnetization transfer ratio (MTR) data measured in 18 patients with clinically isolated syndrome suggestive of MS (CISSMS) and 18 matched control subjects.
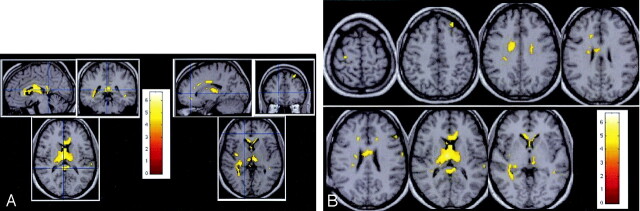
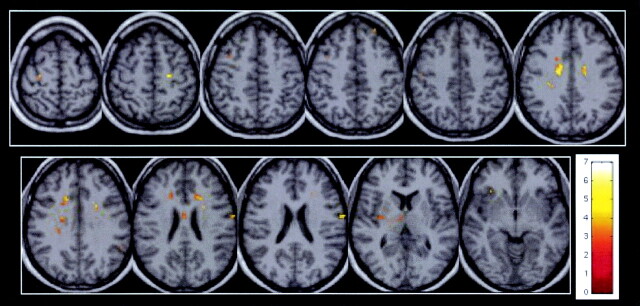
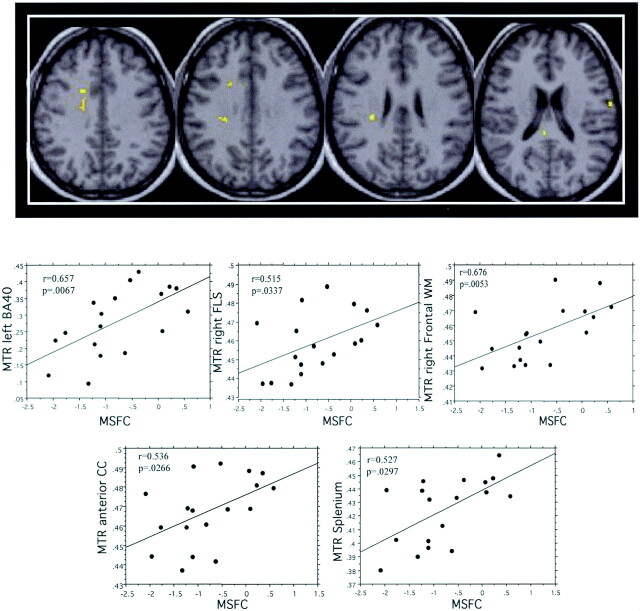
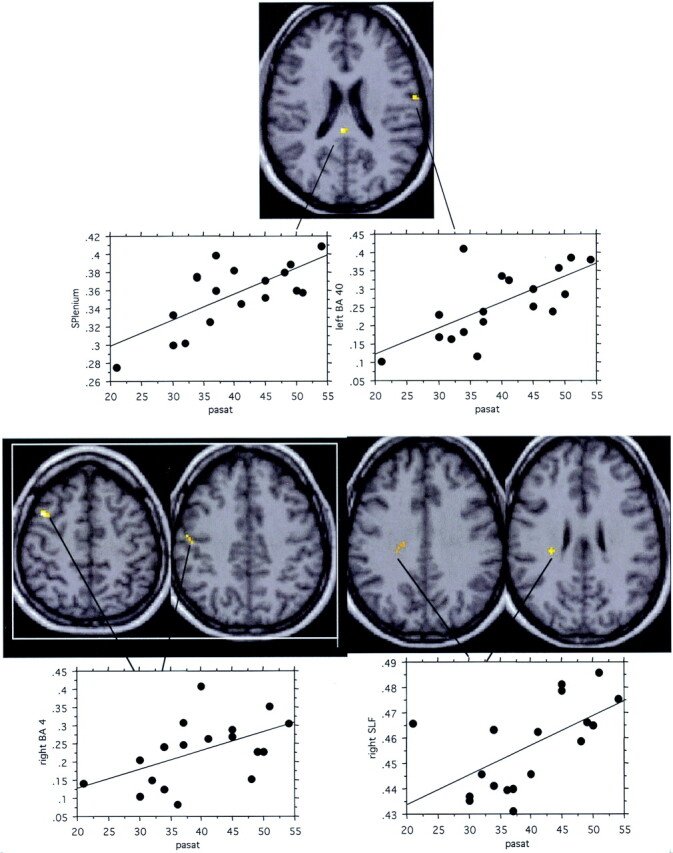
Results: In the patients with CISSMS, a pattern of significant low MTR values was observed in the white matter, corpus callosum, bilateral occipitofrontal fascicles, right fornix, right parietal white matter, external capsule, right superior longitudinal fasciculus (SLF), right inferior longitudinal fasciculus, optica radiata, parietal white matter, right cingulum, gray matter, bilateral thalamus, bilateral caudate, right insula, and left Brodmann area (BA) 8. No correlation was found between local MTR decrease and Expanded Disability Status Scale score. Significant correlations between MTR and MS Functional Composite scores (Spearman rank test, P <.05) were observed in the left BA40, right SLF, right frontal white matter, splenium, and anterior corpus callosum. Local MTR values correlated with Paced Auditory Serial Addition Test scores in the left BA40, right BA4, right SLF, and splenium.
Conclusion: Statistical mapping analysis of brain MTR data provides valuable information on the relationship between the location of brain tissue damage and its functional impact in patients with MS, even in the earliest stage of the disease.
Figures
Similar articles
-
Voxel-based analysis of MTR images: a method to locate gray matter abnormalities in patients at the earliest stage of multiple sclerosis.J Magn Reson Imaging. 2004 Nov;20(5):765-71. doi: 10.1002/jmri.20178. J Magn Reson Imaging. 2004. PMID: 15503338 Clinical Trial.
-
Magnetization transfer ratio histogram analysis of gray matter in relapsing-remitting multiple sclerosis.AJNR Am J Neuroradiol. 2001 Mar;22(3):470-5. AJNR Am J Neuroradiol. 2001. PMID: 11237968 Free PMC article.
-
Localized grey matter damage in early primary progressive multiple sclerosis contributes to disability.Neuroimage. 2007 Aug 1;37(1):253-61. doi: 10.1016/j.neuroimage.2007.04.056. Epub 2007 May 18. Neuroimage. 2007. PMID: 17566765
-
Magnetic resonance study of the influence of tissue damage and cortical reorganization on PASAT performance at the earliest stage of multiple sclerosis.Hum Brain Mapp. 2005 Mar;24(3):216-28. doi: 10.1002/hbm.20083. Hum Brain Mapp. 2005. PMID: 15543553 Free PMC article.
-
Serial analysis of magnetization-transfer histograms and Expanded Disability Status Scale scores in patients with relapsing-remitting multiple sclerosis.AJNR Am J Neuroradiol. 1999 Nov-Dec;20(10):1946-50. AJNR Am J Neuroradiol. 1999. PMID: 10588123 Free PMC article.
Cited by
-
Fornix as an imaging marker for episodic memory deficits in healthy aging and in various neurological disorders.Front Aging Neurosci. 2015 Jan 14;6:343. doi: 10.3389/fnagi.2014.00343. eCollection 2014. Front Aging Neurosci. 2015. PMID: 25642186 Free PMC article. Review.
-
Nonconventional MRI and microstructural cerebral changes in multiple sclerosis.Nat Rev Neurol. 2015 Dec;11(12):676-86. doi: 10.1038/nrneurol.2015.194. Epub 2015 Nov 3. Nat Rev Neurol. 2015. PMID: 26526531 Review.
-
Magnetization transfer magnetic resonance imaging of the brain, spinal cord, and optic nerve.Neurotherapeutics. 2007 Jul;4(3):401-13. doi: 10.1016/j.nurt.2007.03.002. Neurotherapeutics. 2007. PMID: 17599705 Free PMC article. Review.
-
Functional brain network changes associated with maintenance of cognitive function in multiple sclerosis.Front Hum Neurosci. 2010 Nov 22;4:219. doi: 10.3389/fnhum.2010.00219. eCollection 2010. Front Hum Neurosci. 2010. PMID: 21152340 Free PMC article.
-
MR imaging of gray matter involvement in multiple sclerosis: implications for understanding disease pathophysiology and monitoring treatment efficacy.AJNR Am J Neuroradiol. 2010 Aug;31(7):1171-7. doi: 10.3174/ajnr.A1944. Epub 2009 Dec 31. AJNR Am J Neuroradiol. 2010. PMID: 20044503 Free PMC article. Review.
References
-
- McDonald WI, Compston A, Edan G, et al. Recommended diagnostic criteria for multiple sclerosis: guidelines from the international panel on the diagnosis of multiple sclerosis. Ann Neurol 2001;50:121–127 - PubMed
-
- Miki Y, Grossman RI, Udupa JK, et al. Relapsing-remitting multiple sclerosis: longitudinal analysis of MR images–lack of correlation between changes in T2 lesion volume and clinical findings. Radiology 1999;213:395–399 - PubMed
-
- Nijeholt GJ, van Walderveen MA, Castelijns JA, et al. Brain and spinal cord abnormalities in multiple sclerosis: correlation between MRI parameters, clinical subtypes and symptoms. Brain 1998;121:687–697 - PubMed
-
- Reddy H, Narayanan S, Arnoutelis R, et al. Evidence for adaptive functional changes in the cerebral cortex with axonal injury from multiple sclerosis. Brain 2000;123:2314–2320 - PubMed
-
- Filippi M, Rocca MA, Falini A, et al. Correlations between structural CNS damage and functional MRI changes in primary progressive MS. Neuroimage 2002;15:537–546 - PubMed
Publication types
MeSH terms
LinkOut - more resources
Full Text Sources
Medical