. 2005 Mar 15;563(Pt 3):777-93.
doi: 10.1113/jphysiol.2004.080655. Epub 2005 Jan 20.

Reduced glycine transporter type 1 expression leads to major changes in glutamatergic neurotransmission of CA1 hippocampal neurones in mice

Affiliations

Reduced glycine transporter type 1 expression leads to major changes in glutamatergic neurotransmission of CA1 hippocampal neurones in mice

Marzia Martina et al. J Physiol. .

Abstract

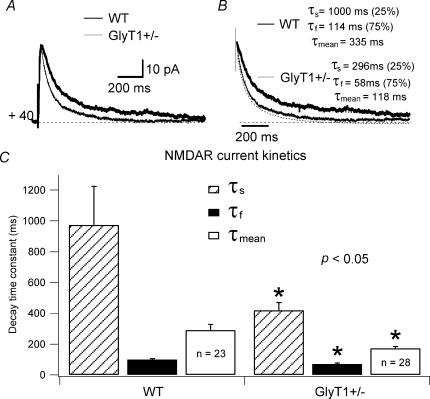
To investigate the effects of persistent elevation of synaptic glycine at Schaffer collateral-CA1 synapses of the hippocampus, we studied the glutamatergic synaptic transmission in acute brain slices from mice with reduced expression of glycine transporter type 1 (GlyT1+/-) as compared to wild type (WT) littermates using whole-cell patch-clamp recordings of CA1 pyramidal cells. We observed faster decay kinetics, reduced ifenprodil sensitivity and increased zinc-induced antagonism in N-methyl-d-aspartate receptor (NMDAR) currents of GlyT1+/- mice. Moreover, the ratio alpha-amino-3-hydroxy-5-methylisoxazole-4-propionic acid receptor (AMPAR)/NMDAR was decreased in mutants compared to WT. Surprisingly, this change was associated with a reduction in the number of AMPARs expressed at the CA1 synapses in the mutants compared to WT. Overall, these findings highlight the importance of GlyT1 in regulating glutamatergic neurotransmission.


Figures

Figure 1
Figure 1. The administration of 10 μm glycine slows the decay time course of the evoked NMDAR currents in WT but not in GlyT1+/− CA1 pyramidal cells
Responses were evoked by bipolar electrical stimuli at Vm = −70 mV in CA1 pyramidal cells of WT (A) and GlyT1+/− (B) mice. The NMDAR currents recorded in low Mg2+ ACSF (thin line), and during application of glycine (thick line), are superimposed. The application of glycine did not change the amplitude of the NMDAR currents in GlyT1+/− CA1 pyramidal cells (B). Fitting of the decay time course of NMDAR currents in low Mg2+ ACSF (thin broken line) and during application of glycine (thick broken line) are shown. The fitting traces were moved from the NMDAR current traces for reason of clarity. The τmean values were calculated (see Methods) and the values for the NMDAR currents shown. Note that the decay of the NMDAR currents in GlyT1+/− CA1 pyramidal cells is faster than in WT, before and during the application of glycine (10 μm). Each trace is an average of 20 traces. C, the NMDAR currents recorded in low Mg2+ ACSF, as shown in A and B, are scaled and the fitting traces shown.
Figure 2
Figure 2. NMDAR current deactivation time constants are faster in GlyT1+/− CA1 pyramidal cells
Neurones were recorded at +40 mV to relieve the Mg2+ block of the NMDAR and outward currents were evoked by bipolar electrical stimuli. A, recorded NMDAR currents of one GlyT1+/− (thin line), and one WT CA1 pyramidal cell (thick line) are superimposed. B, the same traces as illustrated in A are scaled and the fitting traces shown. Each trace is an average of 20 traces. Values of τs, τf, and τmean for one WT and one GlyT1+/− CA1 pyramidal cell NMDAR current are given. C, histogram of the averaged τs, τf, and τmean for NMDAR currents of WT (n = 23) and GlyT1+/−(n = 28) CA1 pyramidal cells. *Significant difference between WT and GlyT1+/− mice (P < 0.05). Error bars are s.e.m.
Figure 3
Figure 3. Morphological and physiological properties of WT and GlyT1+/− CA1 pyramidal cells. Confocal images of WT (A), and GlyT1+/− (C) CA1 pyramidal cells
The cells were recorded in the CA1 stratum pyramidale of the hippocampus. B and D, confocal images of the boxed dendritic regions shown in A and C, respectively. The arrowheads indicate dendritic spines. E and F, the voltage responses of the same pyramidal cells as in A and C to a series of intracellular current pulses are shown. The current was applied at rest (−73 and −75 mV, respectively). Abbreviations: so, stratum oriens; sp., stratum pyramidale; sr, stratum radiatum; slm, stratum lacunosum moleculare.
Figure 4
Figure 4. Differences in ifenprodil sensitivity of NMDAR currents in WT and GlyT1+/− CA1 pyramidal cells
A and B, examples of averaged NMDAR current traces at +40 mV in the absence (thick line) and presence (thin line) of ifenprodil (10 μm) are shown for WT (A) and GlyT1+/− (B). C, summarized data from WT (n = 4) and GlyT1+/−(n = 5) CA1 pyramidal cells at +40 mV. Ifenprodil reduces the amplitude of the NMDAR currents by 68.2 ± 7.8% in WT and 44 ± 6.6% in GlyT1+/− 0. * Significant difference between WT and GlyT1+/− mice (P < 0.05). D, I–V relationships of NMDAR currents are shown for WT (•; n = 7) and GlyT1+/− (▪; n = 7). Error bars are s.e.m.
Figure 5
Figure 5. Differences in zinc sensitivity of NMDAR currents in WT and GlyT1+/− CA1 pyramidal cells
A and B, examples of averaged NMDAR current traces at +40 mV in the absence (thick line) and presence (thin line) of ZnCl2 (100 nm) are shown for WT (A) and GlyT1+/− (B). C, summarized data from WT (n = 9) and GlyT1+/−(n = 9) CA1 pyramidal cells at +40 mV. ZnCl2 reduces the amplitude of the NMDAR currents by 43.02 ± 4.7% in WT and 62.8 ± 4.2% in GlyT1+/−. D, effect of ZnCl2 on NMDAR currents as a function of time in WT (•) and GlyT1+/− (○) mice. * Significant difference between WT and GlyT1+/− mice (P < 0.05). Error bars are s.e.m.
Figure 6
Figure 6. AMPAR/NMDAR ratio is smaller in GlyT1+/− CA1 pyramidal cells
A and B, examples of NMDAR currents (thin line) and derived AMPAR currents (thick line) are shown for WT (A) and GlyT1+/− (B) CA1 pyramidal cells. (C) Histogram of the AMPAR/NMDAR ratios for WT (n = 9) and GlyT1+/−(n = 9) CA1 pyramidal cells. *The AMPAR/NMDAR ratio in GlyT1+/− is significantly smaller than in WT CA1 pyramidal cells (P < 0.05).
Figure 7
Figure 7. AMPAR current properties in WT and GlyT1+/− CA1 pyramidal cells
Pyramidal cells were recorded in ACSF containing picrotoxin (50 μm), CGP 52432 (10 μm), strychnine (0.5 μm) and AP5 (50 μm). A and B, examples of AMPAR current traces for WT (A) and GlyT1+/− (B) pyramidal cells. C, I–V relationship of AMPAR currents in WT (○; n = 5) and GlyT1+/− (•; n = 5) CA1 pyramidal cells. Error bars are s.e.m.
Figure 8
Figure 8. Miniature postsynaptic current (mEPSC) quantal size is smaller in GlyT1+/− CA1 pyramidal cells
A, cumulative amplitude distributions obtained from WT (n = 9, solid line) and GlyT1+/− CA1 pyramidal cells (n = 7; broken line). The threshold for peak detection was set between 5 and 10 pA. Data were binned in 1 pA intervals. B, bar graph showing mEPSC amplitude (quantal size). The mEPSC amplitude is larger in WT (11.12 ± 0.41 pA, n = 9) compared to GlyT1+/− CA1 pyramidal cells (7.95 ± 0.78 pA, n = 9; *P < 0.05, paired t test). C, cumulative frequency distributions from WT (n = 9, solid line) and GlyT1+/− (n = 7; broken line) CA1 pyramidal cells. D, histogram of the mEPSC frequency for WT (0.224 ± 0.03 Hz, n = 9) and GlyT1+/− (0.243 ± 0.09 Hz, n = 7). No significant difference was found. E, examples of averaged mEPSCs for WT (thick line; average of 74 events) and GlyT1+/− (thin line; average 150 events) are superimposed. Error bars are s.e.m.
Figure 9
Figure 9. NMDAR-mediated miniature postsynaptic current (NMDAR mEPSC) deactivation kinetics are faster in GlyT1+/− CA1 pyramidal cells
NMDAR mEPSCs were recorded from WT and GlyT1+/− CA1 pyramidal cells. A, representative recording traces of NMDAR mEPSCs from WT and GlyT1+/− CA1 pyramidal cells. The threshold for peak detection was set between 10 and 20 pA. Data were binned in 1 pA intervals. B, averaged NMDAR mEPSCs for WT (upper trace; average of 74 events) and GlyT1+/− (lower traces; average of 120 events) CA1 pyramidal cells. C, the same traces as illustrated in B are scaled up and the NMDAR mEPSC deactivation τmean values are given. DF, histograms showing the averaged τmean, frequency and amplitude of WT (n = 10) and GlyT1+/−(n = 8) CA1 pyramidal cells. *The τmean of NMDAR mEPSCs in WT is significantly slower than in GlyT1+/− CA1 pyramidal cells (P < 0.05, paired t test). G, cumulative probability histogram of NMDAR mEPSC amplitude of WT and GlyT1+/− CA1 pyramidal cells. Note the Kolmogorov–Smirnov two-sample test shows no difference in the distribution of the NMDAR mEPSC amplitudes in WT and GlyT1+/− mice (P > 0.1). Error bars are s.e.m.
Figure 10
Figure 10. AMPAR-mediated miniature postsynaptic current (AMPAR mEPSC) quantal size is smaller in GlyT1+/− CA1 pyramidal cells
A, cumulative probability histogram of AMPAR mEPSC amplitude of WT (n = 13) and GlyT1+/−(n = 8) CA1 pyramidal cells. Note the Kolmogorov–Smirnov two-sample test shows a difference in the distribution of the AMPAR mEPSC amplitudes in WT and GlyT1+/− mice (P < 0.05). B, histogram showing the averaged AMPAR mEPSC amplitude in WT (n = 13) and GlyT1+/−(n = 8) CA1 pyramidal cells. *The amplitude of AMPAR mEPSCs in WT is significantly larger than in GlyT1+/− CA1 pyramidal cells (P < 0.05, paired t test). C, averaged AMPAR mEPSCs for WT (thick line) and GlyT1+/− (thin line) CA1 pyramidal cells. Error bars are s.e.m.

Similar articles

Cited by

References

    1. Amaral DG, Witter MP. The three dimensional organization of the hippocampal formation: a review of anatomical data. Neuroscience. 1989;31:571–591. 10.1016/0306-4522(89)90424-7. - DOI - PubMed
    1. Berger AJ, Dieudonne S, Ascher P. Glycine uptake governs glycine site occupancy at NMDA receptors of excitatory synapses. J Neurophysiol. 1998;80:3336–3340. - PubMed
    1. Bergeron R, Meyer TM, Coyle JT, Greene RW. Modulation of N-methyl-d-aspartate receptor function by glycine transport. Proc Natl Acad Sci U S A. 1998;95:15730–15734. - PMC - PubMed
    1. Bogden JD, Troiano RA, Joselow MM. Copper, zinc, magnesium, and calcium in plasma and cerebrospinal fluid of patients with neurological diseases. Clin Chem. 1977;23:485–489. - PubMed
    1. Buller AM, Larson HC, Schneider BE, Beaton JA, Morrisett RA, Monaghan DT. The molecular basis of NMDA receptor subtypes: native receptor diversity is predicted by subunit composition. J Neurosci. 1994;14:5471–5484. - PMC - PubMed

Publication types

MeSH terms

LinkOut - more resources