. 2005 Mar 15;563(Pt 3):883-93.
doi: 10.1113/jphysiol.2004.080085. Epub 2005 Jan 20.

Carbon dioxide sensitivity during hypoglycaemia-induced, elevated metabolism in the anaesthetized rat

Affiliations

Carbon dioxide sensitivity during hypoglycaemia-induced, elevated metabolism in the anaesthetized rat

I Bin-Jaliah et al. J Physiol. .

Abstract

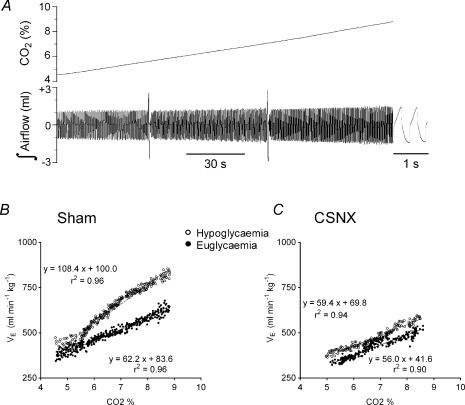
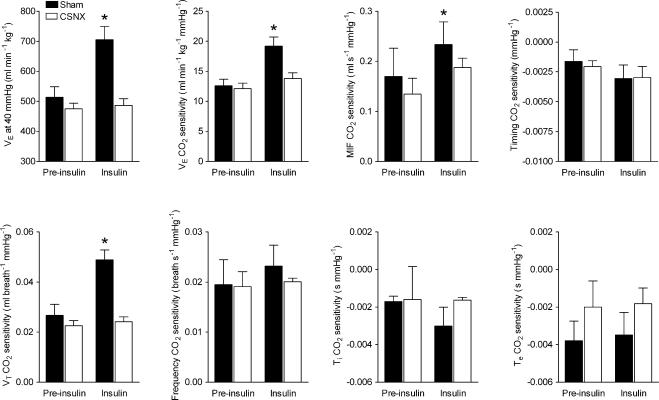
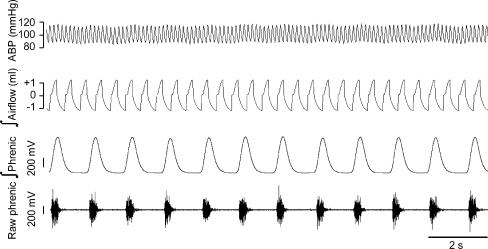
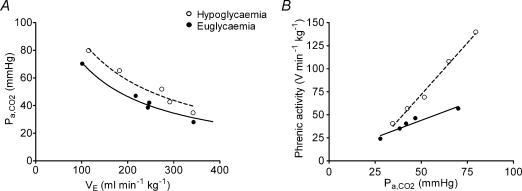
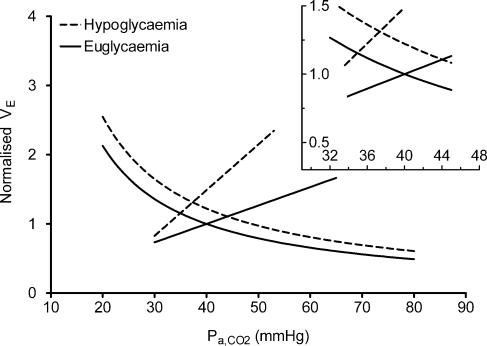
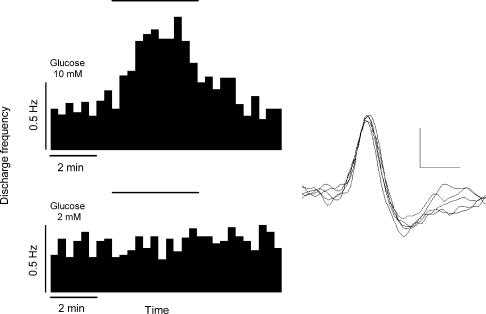
We have utilized an anaesthetized rat model of insulin-induced hypoglycaemia to test the hypothesis that peripheral chemoreceptor gain is augmented during hypermetabolism. Insulin infusion at 0.4 U kg (-1)min(-1) decreased blood glucose concentration significantly to 3.37 +/- 0.12 mmol l(-1). Whole-body metabolism and basal ventilation were elevated without increase in P(a,CO(2)) (altered non-significantly from the control level, to 37.3 +/- 2.6 mmHg). Chemoreceptor gain, measured either as spontaneous ventilatory airflow sensitivity to P(a,CO(2)) during rebreathing, or by phrenic minute activity responses to altered P(a,CO(2)) induced by varying the level of artificial ventilation, was doubled during the period of hypermetabolism. This stimulatory effect was primarily upon the mean inspiratory flow rate, or phrenic ramp component of breathing and was reduced by 75% following bilateral carotid sinus nerve section. In vitro recordings of single carotid body chemoafferents showed that reducing superfusate glucose concentration from 10 mM to 2 mM reduced CO(2) chemosensitivity significantly from 0.007 +/- 0.002 Hz mmHg(-1) to 0.001 +/- 0.002 Hz mmHg(-1). Taken together, these data suggest that the hyperpnoea observed during hypermetabolism might be mediated by an increase in the CO(2) sensitivity of the carotid body, and this effect is not due to the insulin-induced fall in blood glucose concentration.


Figures

Figure 1
Figure 1. Carotid body-mediated augmentation of ventilatory CO2 chemosensitivity measured during rebreathing
A, representative traces showing increasing percentage inspired CO2 (upper trace) and corresponding spontaneous, integrated tracheal airflow (lower trace) during a single rebreathing experiment in one animal. Inspiratory and expiratory flows were separately integrated and depicted in a single trace with + indicating inspiratory volume and − indicating expiratory volume. Timescale expanded at right side. B, breath by breath against percentage CO2 in a single sham animal, during euglycaemia (•; from the example data shown in A) and hypoglycaemia (○). increased linearly with increasing CO2 (P < 0.0001; linear regression), and the ventilatory CO2 sensitivity was taken as the slope of the regression. During insulin-induced hypoglycaemia there was an increase of ventilatory CO2 sensitivity. C, breath by breath against percentage CO2 in a single CSNX different animal, during euglycaemia (•), and hypoglycaemia (○). increased linearly with increasing CO2 (P < 0.0001; linear regression) but the ventilatory CO2 sensitivity did not change during hypoglycaemia.
Figure 2
Figure 2. Carotid body-mediated augmentation of basal spontaneous ventilation and ventilatory CO2 chemosensitivity measured during rebreathing
Means ± s.e.m. of at 40 mmHg, sensitivity, mean inspiratory flow rate (MIF = VT/Ti) CO2 sensitivity, timing (Ti/Ttot) CO2 sensitivity, tidal volume (VT) CO2 sensitivity, frequency CO2 sensitivity, inspiratory time (Ti) CO2 sensitivity and expiratory time (Te) CO2 sensitivity in sham (n = 6) and CSNX (n = 6) animals, pre-insulin (40–10 min prior) and during (20–120 min post-) insulin infusion at 0.4 u min−1 kg−1. *Significant difference (P < 0.05) from pre-insulin levels.
Figure 3
Figure 3. Phrenic nerve activity during adjustable artificial ventilation
Steady-state measurement of phrenic nerve discharge, artificial ventilation and blood gases were recorded in anaesthetized, vagotomized, paralysed and artificially ventilated rats. By modifying the level of artificial ventilation, different levels of PaCO2 could be achieved. Illustrative traces from a single experiment are shown (from top down): arterial blood pressure, integrated tracheal airflow, integrated phrenic activity (100 ms time constant) and raw phrenic nerve discharge. For each steady state, ventilation could be measured as integrated airflow and as phrenic minute activity. By determining the effect of varying airflow upon Pa,CO2 and the effect of Pa,CO2 upon phrenic minute activity, both curves and CO2 respiratory controller equations could be derived simultaneously.
Figure 4
Figure 4. The effect of upon Pa,CO2 and the effect of ΔPaCO2 upon phrenic nerve activity; increased metabolism and CO2 chemosensitivity during hypoglycaemia
A, representative data taken from a single experiment. Steady-state Pa,CO2 is sampled at various levels of artificial measured as integrated tracheal airflow during euglycaemia (•) and hypoglycaemia (○). Data are shown fitted by hyperbolic functions: and during euglycaemia (r2= 0.98) and hypoglycaemia (r2= 0.95), respectively. During insulin-induced hypoglycaemia, there was an upward shift in the position of the curves. B, representative raw data from the same animal. Phrenic minute activity is measured at the same steady-state levels of Pa,CO2 shown in A. Data are shown fitted by linear regression: phrenic minute activity = 0.75Pa,CO2+ 6.6 and phrenic minute activity = 2.24Pa,CO2− 39.9 during euglycaemia (r2= 0.92) and hypoglycaemia (r2= 0.99), respectively. Linear regression showed an increase of phrenic CO2 sensitivity during insulin-induced hypoglycaemia.
Figure 5
Figure 5. The normalized mean curves and linear CO2 sensitivities during euglycaemia and hypoglycaemia
The mean curves and the mean CO2 sensitivities for all animals (n = 6) determined by averaging the equation parameters determined from each experiment. The curves are shown overlaid after correction for different units of and normalization (see text for details). The inset is an expanded portion of the graph. The intercept during euglycaemia (solid line) and the intercept during hypoglycaemia (broken line) represent the unique steady state and Pa,CO2 in each condition and indicate that Pa,CO2 is not elevated during the hypermetabolism of hypoglycaemia due to the increase in the CO2 sensitivity. Standard errors have not been shown in order to aid clarity.
Figure 6
Figure 6. In vitro carotid sinus nerve CO2 chemosensitivity is not increased by decreasing [glucose]
Single-fibre chemoafferent discharge recorded from one carotid body during control (10 mm glucose; above) and low-glucose superfusion (2 mm glucose; below). Discharge was binned into 20-s periods and frequency calculated as impulses s−1 (Hz). Hypercapnia, raising the superfusate PCO2 from 40 mmHg to 80 mmHg, indicated by the horizontal bars, increased the chemoreceptor discharge frequency during control glucose perfusate. This effect was absent during low glucose superfusion. On the right are shown four superimposed afferent action potentials from this recording. The vertical scale bar is 100 μV, horizontal scale bar 0.4 ms.

References

    1. Asmussen E. Physiology of Muscular Exercise. New York: American Heart Association; 1967. Exercise and the regulation of ventilation; pp. 132–145.
    1. Asmussen E, Nielsen M. Studies on the regulation of respiration in heavy work. Acta Physiol Scand. 1946;12:171–178.
    1. Asmussen E, Nielsen M. Ventilatory response to CO2 during work at normal and at low oxygen tensions. Acta Physiol Scand. 1957;39:27–35. - PubMed
    1. Band DM, Linton RAF. The effect of potassium on carotid-body chemoreceptor discharge in the anesthetized cat. J Physiol. 1986;381:39–47. - PMC - PubMed
    1. Band DM, Linton RA. The effect of potassium and venous CO2 loading on chemoreceptor firing in anaesthetized cats. Respir Physiol. 1989;76:173–178. - PubMed

Publication types