. 2005 Mar;11(3):308-22.
doi: 10.1261/rna.7860605. Epub 2005 Jan 20.

Identification and characterization of critical cis-acting sequences within the yeast Ty1 retrotransposon

Affiliations

Identification and characterization of critical cis-acting sequences within the yeast Ty1 retrotransposon

Eric C Bolton et al. RNA. 2005 Mar.

Abstract

The yeast long terminal repeat (LTR) retrotransposon Ty1, like retroviruses, encodes a terminally redundant RNA, which is packaged into virus-like particles (VLPs) and is converted to a DNA copy by the process of reverse transcription. Mutations predicted to interfere with the priming events during reverse transcription and hence inhibit replication are known to dramatically decrease transposition of Ty1. However, additional cis-acting sequences responsible for Ty1 replication and RNA dimerization and packaging have remained elusive. Here we describe a modular mini-Ty1 element encoding the minimal sequence that can be retrotransposed by the Ty1 proteins, supplied in trans by a helper construct. Using a mutagenic screening strategy, we recovered transposition-deficient modular mini-Ty1-HIS3 elements with mutations in sequences required in cis for Ty1 replication and integration. Two distinct clusters of mutations mapped near the 5'-end of the Ty1 RNA. The clusters define a GAGGAGA sequence at the extreme 5'-end of the Ty1 transcript and a complementary downstream UCUCCUC sequence, 264 nt into the RNA. Disruption of the reverse complementarity of these two sequences decreased transposition and restoration of complementarity rescued transposition to wild-type levels. Ty1 cDNA was reduced in cells expressing RNAs with mutations in either of these short sequences, despite nearly normal levels of Ty1 RNA and VLPs. Our results suggest that the intramolecular interaction between the 5'-GAGGAGA and UCUCCUC sequences stabilizes an RNA structure required for efficient initiation of reverse transcription.


Figures

FIGURE 1.
FIGURE 1.
The modular mini-Ty1 transposition system. (A) Structures of the modular mini-Ty1-HIS3 donor and helper plasmids. The U3 portion of the 5′-LTR (the Ty1 promoter) has been replaced with the inducible GAL1 promoter (striped box). The 2μ sequence contains a yeast replication origin. pBR322 sequences are indicated by lines, while boxes indicate yeast sequences. The HIS3 marker gene has the opposite transcriptional orientation as the mini-Ty1 element. Notice that the helper plasmid lacks a functional PBS as well as the PPT and 3′-LTR, thus it cannot be reverse-transcribed or transposed. GAG and POL refer to the two ORFs of the Ty1 element. (B) Transposition of various combinations of mini-Ty1 elements (mini) and helper constructs (helper) in wild-type (RAD52) and rad52Δ stains. The PvuII–HpaI fragment of the mini-Ty1 element is deleted in the miniΔ construct, pECB5K1, and the helperΔ construct, p425 GAL1 (Mumberg et al. 1995), entirely lacks Ty1 coding sequence.
FIGURE 2.
FIGURE 2.
Summary of transposition-deficient mini-Ty1-HIS3 elements with one to two mutations. (A) Mutations identified in the 5′-region. Sequences required for priming events during reverse transcription, which include the PBS, box 0, box 1, and box 2.1, are indicated. Vertical black bars indicate the positions of single-nucleotide mutations within the mutagenized region of the mini-Ty1-HIS3 element. The height of the vertical bars indicates the number of times a mutation at that nucleotide position was independently isolated. (*) Two clusters of mutations were in regions not previously known to be required for transposition. (B) Summary of transposition-deficient mini-Ty1-HIS3 elements with one to two mutations in the 3′-region. Sequences required for priming events during reverse transcription, like PPT1, are indicated. For comparison, aligned PPT1, PPT2, and flanking sequences are shown. Previously identified mutations in PPT1 that abolish transposition (Wilhelm et al. 1999) are indicated in small white type on black boxes. Sequence in large gray type indicates single-base mutations on a transposition-deficient mini-Ty1-HIS3 element during the original 3′-region screen. Bases in small gray type denote the mutant nucleotides identified at the position of the mutation.
FIGURE 3.
FIGURE 3.
Verified mutations that reduce retrotransposition of the mini-Ty1-HIS3 element. (A) Summary of subcloned single nucleotide changes in the 5′-region of the mini-Ty1-HIS3 element and their effect on transposition. Vertical orange bars denote the positions of single-base mutations that reduced transposition, while mutations that did not affect transposition are indicated by blue bars. Bracketed sequences denote 5′-region sequences of interest such as the PBS region, the putative dimerization and packaging (D/P) region, and 5′-R and U5 regions, all of which are required for transposition. (*) Two clusters of mutations were not known to be required for transposition. (B) The positions of single nucleotide changes in the 5′-U5 and PBS regions and their effect on transposition. Modified from the original predicted secondary structure for the Ty1 RNA (black letters) with the yeast initiator tRNAiMet (white letters on black background) complex (Friant et al. 1996). Orange circles indicate mutated bases that decreased transposition, while mutations that did not affect transposition are circled in blue. The corresponding mutant bases are indicated in orange or blue type.
FIGURE 4.
FIGURE 4.
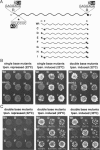
Summary of mutations within 5′-GAGGAGA, 5′-UCUC CUC, and 3′-GAGGAGA regions that reduced mini-Ty1-HIS3 transposition. Sequence in large gray type indicates single-base mutations on a transposition-deficient mini-Ty1-HIS3 element isolated during the original 5′- and 3′-region screens. Nucleotides in large orange type signify subcloned single-base mutations that were retested and demonstrated decreased transposition. Bases in small gray or orange type denote the mutant nucleotides identified at the position of the mutation. (*) Two clusters of mutations were not previously known to be required for transposition.
FIGURE 5.
FIGURE 5.
Base-pairing between two Ty1 sequences near the 5′-end of the RNA is required for efficient transposition. (A) Cartoon indicating the positions of the mutated Ty1 sequences. Expressed Ty1 RNAs (black wavy lines) containing combinations of single-base (boxed black letter on white background) or double-base (boxed white letters on black background) mutations (positions indicated by the black X). (R) The sequences are found within the repeated region of the RNA; (*) indicates the location of the UCUCCUC sequence, downstream of the PvuII site in the Ty1 element. Transposition of (B) modular mini-Ty1-HIS3 and (C) full-length Ty1-mhis3AI elements containing combinations of mutations that were engineered into the UCUCCUC sequence as well as the reverse complementary sequences (GAGGAGA) within the R regions located at the ends of the Ty1 RNA. Transposition was assayed under repressing (glucose medium) and inducing (galactose medium) conditions at the indicated temperatures. The miniΔ, pECB5K1, and RT-, pGTy1-H3-mhis3AI DD-DE (Uzun and Gabriel 2001), constructs contain transposition-deficient Ty1 elements. Transposition frequencies from separately performed quantitative transposition assays are indicated as the percentage of wild type in white lettering.
FIGURE 6.
FIGURE 6.
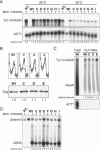
Characterization of Ty1 RNA, VLPs, and cDNA produced from mutant full-length Ty1-mhis3AI elements. (A) RNA blot comparing the steady-state expression levels of wild-type (Wt) and mutant Ty1-mhis3AI elements (double-base mutants C–I from Fig. 5 ▶). ACT1 hybridization was used as a loading control. RNA levels were assayed under repressing (-, glucose medium) and inducing (+, galactose medium) conditions at the indicated temperatures. (B, upper panels) Chart tracings of VLP peaks isolated from cells expressing wild-type (Wt) and mutant Ty1-mhis3AI derivatives (double-base mutants C–E from Fig. 5 ▶). Fractionation of the VLP gradients was monitored by the absorbance at 254 nm. In numerous similar experiments, VLP peaks are absent for cells lacking a pGTy1 element or grown under Ty1-mhis3AI-repressing conditions. (B, lower panel) Immunoblot of the peak VLP-containing gradient fractions using anti-Gag antibody. Immunoblotting was performed as described (Bolton et al. 2002). The amount of Gag protein detected for mutant relative to wild-type VLPs is indicated. (C) RNA blot comparing the his3AI-marked Ty1 RNA isolated from VLPs produced by wild-type (Wt) and mutant Ty1-mhis3AI elements. Total RNA isolated from cells expressing the wild-type Ty1-mhis3AI element was used as a control for specific packaging of Ty1-mhis3AI RNA. ACT1 and his3AI hybridization signals detected in the total RNA sample are absent from RNA samples isolated from the various VLPs. (D) Production of HIS3-marked Ty1 cDNA in cells expressing the Ty1-mhis3AI elements. The HIS3 probe hybridized to Ty1 cDNA as well as to the his3AI-marked pGTy1-H3 donor plasmid (internal loading control). Ty1 cDNA production was assayed under repressing (-, glucose medium) and inducing (+, galactose medium) conditions at 22°C. Similar results were observed for Ty1 cDNA production at 30°C.
FIGURE 7.
FIGURE 7.
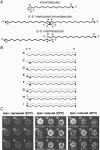
Intra- or intermolecular interactions? (A) Proposed models for the functional interaction between 5′ Ty1 RNA sequences. The black wavy lines represent Ty1 RNA (dot at 3′-end), and the gray dashed lines indicate the base-pairing interactions between the 5′-GAGGAGA and UCUCCUC sequences. (B) Analysis of intra- or intermolecular interactions using a his3AI-marked Ty1 readout in combination with various Ty1-neo elements expressed from a separate plasmid. See text for details. (C) Transposition of full-length wild-type (combination A) or double-base mutant (combinations C–I) Ty1-mhis3AI elements (lower black wavy lines) in combination with wild-type (combinations A–E) or double-base mutant (combinations F–I) Ty1-neo elements (upper gray wavy lines). Transposition was assayed under repressing (glucose medium) and inducing (galactose medium) conditions at the indicated temperatures. Transposition frequencies of Ty1-mhis3AI elements from separately performed quantitative transposition assays are indicated as the percent of wild-type/wild-type (combination A) in white lettering.
FIGURE 8.
FIGURE 8.
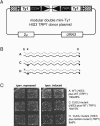
Intra- or intermolecular interactions using the modular mini-Ty1 transposition system? (A) Structure of the modular double mini-Ty1-HIS3 TRP1 donor plasmid. As described in Figure 1 ▶, the inducible GAL1 promoter (striped box), the pBR322 sequences (black lines), and yeast sequences (boxes) are indicated. The HIS3 and TRP1 marker genes have the opposite transcriptional orientation as their mini-Ty1 element. The helper plasmid shown in Figure 1A ▶ was also present in cells to supply Ty1 proteins in trans. (B) Analysis of intermolecular interactions using a HIS3-marked, Ty1 readout (black wavy lines) in combination with various Ty1-TRP1 elements (gray wavy lines) expressed from the same plasmid. See text for details. (C) Transposition of full-length wild-type (combination A) or double-base mutant (combinations C and H) mini-Ty1-HIS3 elements (lower black wavy lines) in combination with wild-type (combinations A and C) or double-base mutant (combination H) mini-Ty1-TRP1 elements (upper gray wavy lines). Transposition was assayed under repressing (glucose medium) and inducing (galactose medium) conditions. Transposition frequencies of mini-Ty1-HIS3 elements from separately performed quantitative transposition assays are indicated as the percent of wild-type/wild-type (combination A).
FIGURE 9.
FIGURE 9.
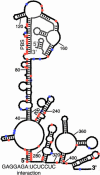
Proposed secondary structure model for the Ty1 RNA. The model was constructed using the mfold program, version 3.1 (http://www.bioinfo.rpi.edu/applications/mfold/old/rna) (Mathews et al. 1999; Zuker 2003) and represents the most stable secondary structure returned for the 1–440 Ty1 RNA and the 1–75 cellular tRNAiMetG = −139.7 kcal/mol) that also agrees with the mutagenesis analysis (see the Results). The cellular tRNAi Met (gray lines) was folded with the Ty1 RNA (black lines) and is shown interacting with the PBS (nucleotides 95–104), box 0 (nucleotides 110–116), box 1 (nucleotides 144–149), and box 2.1 (nucleotides 162–168). The short black lines represent Watson-Crick base pairs, and the filled black circles represent G:U base pairs. The proposed intramolecular interaction between 5′-GAGGAGA (nucleotides 1–7) and UCUCCUC (nucleotides 264–270) sequences and the positions of single nucleotide changes in the 1–440 Ty1 RNA and their effect on transposition are indicated. Filled orange circles depict mutated bases that decreased transposition, while mutations that did not affect transposition are in blue. The black-filled blue circles represent mutated bases in which an A:U base pair was replaced with a G:U base pair.

Similar articles

Cited by

References

    1. Belcourt, M.F. and Farabaugh, P.J. 1990. Ribosomal frameshifting in the yeast retrotransposon Ty: tRNAs induce slippage on a 7 nucleotide minimal site. Cell 62: 339–352. - PMC - PubMed
    1. Bieth, E., Gabus, C., and Darlix, J.L. 1990. A study of the dimer formation of Rous sarcoma virus RNA and of its effect on viral protein synthesis in vitro. Nucleic Acids Res. 18: 119–127. - PMC - PubMed
    1. Boeke, J.D. and Stoye, J.P. 1997. Retrotransposons, endogenous retroviruses, and the evolution of retroelements. In Retroviruses (eds. H. Varmus), pp. 343–435. Cold Spring Harbor Laboratory Press, Cold Spring Harbor, NY. - PubMed
    1. Boeke, J.D., LaCroute, F., and Fink, G.R. 1984. A positive selection for mutants lacking orotidine-5′-phosphate decarboxylase activity in yeast: 5-fluoro-orotic acid resistance. Mol Gen Genet 197: 345–346. - PubMed
    1. Boeke, J.D., Garfinkel, D.J., Styles, C.A., and Fink, G.R. 1985. Ty elements transpose through an RNA intermediate. Cell 40: 491–500. - PubMed

Publication types

LinkOut - more resources