

Inference of demographic history from genealogical trees using reversible jump Markov chain Monte Carlo
- PMID: 15663782
- PMCID: PMC548300
- DOI: 10.1186/1471-2148-5-6
Inference of demographic history from genealogical trees using reversible jump Markov chain Monte Carlo
Abstract
Background: Coalescent theory is a general framework to model genetic variation in a population. Specifically, it allows inference about population parameters from sampled DNA sequences. However, most currently employed variants of coalescent theory only consider very simple demographic scenarios of population size changes, such as exponential growth.
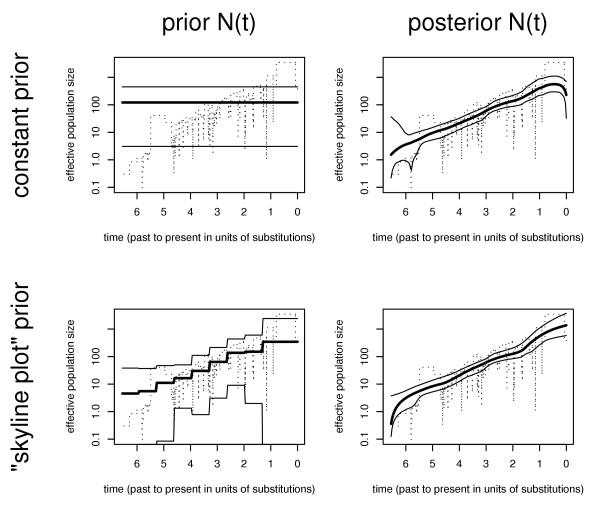
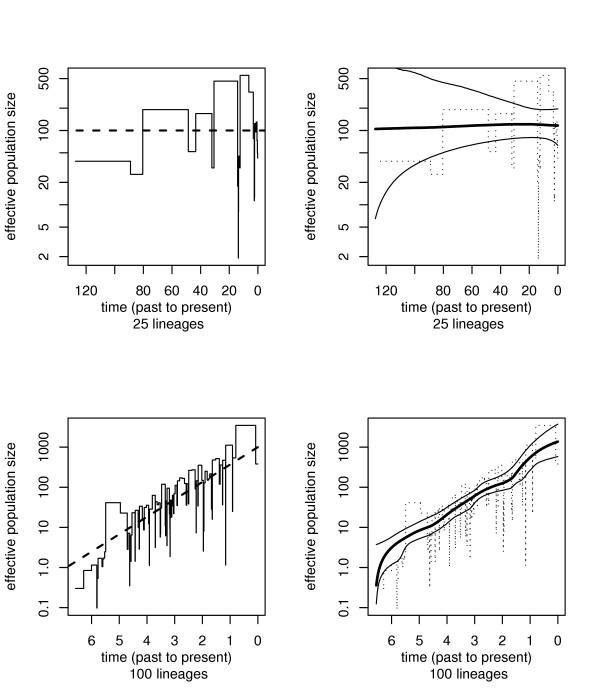
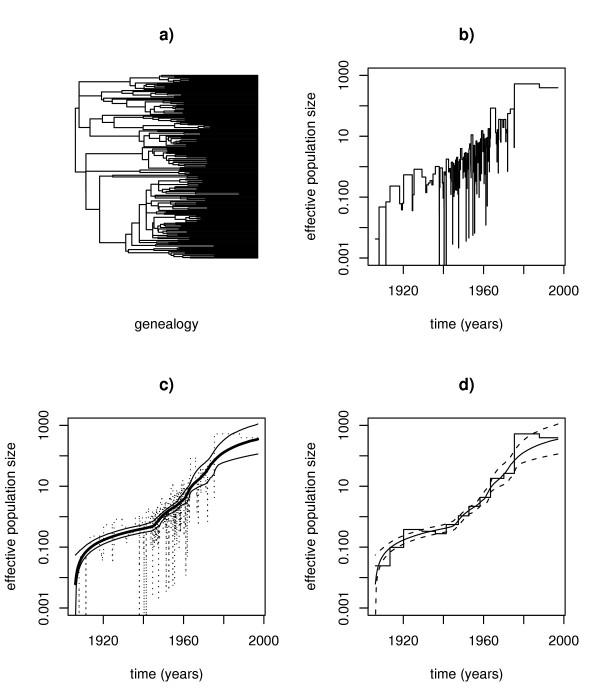
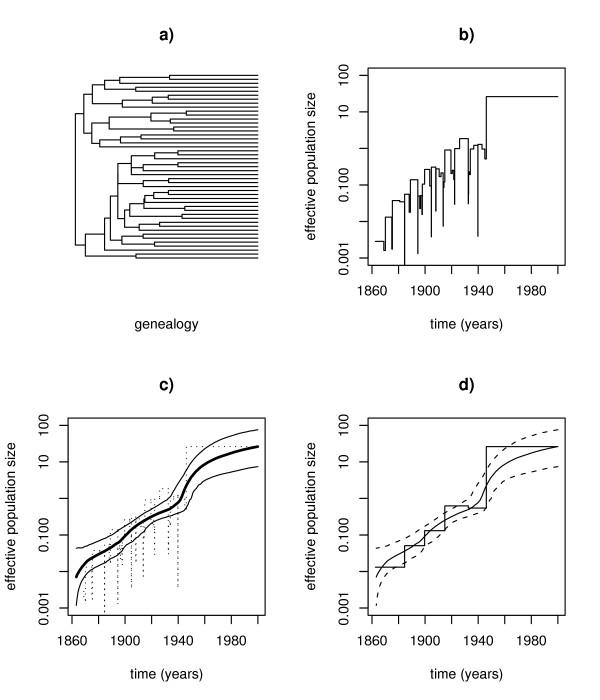
Results: Here we develop a coalescent approach that allows Bayesian non-parametric estimation of the demographic history using genealogies reconstructed from sampled DNA sequences. In this framework inference and model selection is done using reversible jump Markov chain Monte Carlo (MCMC). This method is computationally efficient and overcomes the limitations of related non-parametric approaches such as the skyline plot. We validate the approach using simulated data. Subsequently, we reanalyze HIV-1 sequence data from Central Africa and Hepatitis C virus (HCV) data from Egypt.
Conclusions: The new method provides a Bayesian procedure for non-parametric estimation of the demographic history. By construction it additionally provides confidence limits and may be used jointly with other MCMC-based coalescent approaches.
Figures
References
-
- Kingman JFC. The coalescent. Stoch Proc Applns. 1982;13:235–248. doi: 10.1016/0304-4149(82)90011-4. - DOI
-
- Kingman JFC. On the genealogy of large populations. J Appl Probab. 1982;19A:27–43.
-
- Nordborg M. Coalescent Theory. In: Balding D, Bishop M, Cannings C, editor. Handbook of Statistical Genetics. Chichester: Wiley; 2001. pp. 179–212.
-
- Hein JJ, Schierup MH, Wiuf CH. Gene Genealogies, Variation and Evolution. Oxford: Oxford University Press; 2004.
Publication types
MeSH terms
Substances
LinkOut - more resources
Full Text Sources
