. 2005 Jan;36(1):33-46.
doi: 10.1016/j.bone.2004.09.015. Epub 2004 Nov 24.

Surface plasmon resonance (SPR) confirms that MEPE binds to PHEX via the MEPE-ASARM motif: a model for impaired mineralization in X-linked rickets (HYP)

Affiliations

Surface plasmon resonance (SPR) confirms that MEPE binds to PHEX via the MEPE-ASARM motif: a model for impaired mineralization in X-linked rickets (HYP)

Peter S N Rowe et al. Bone. 2005 Jan.

Abstract

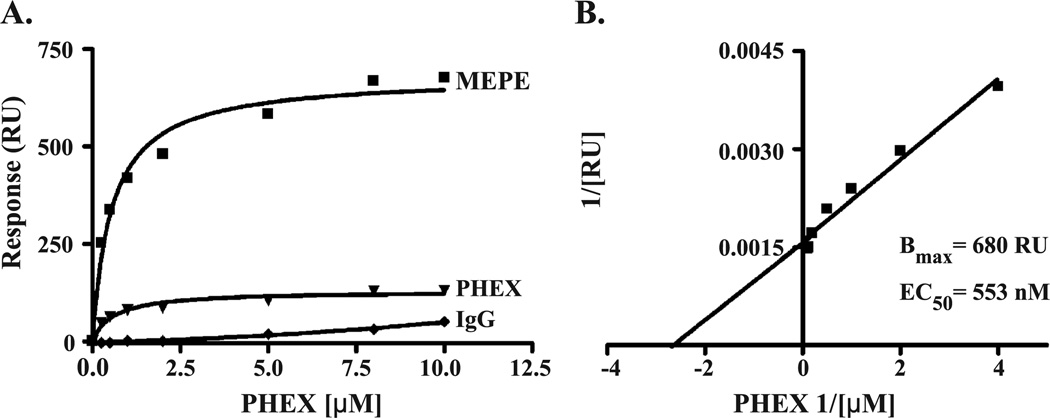
Matrix Extracellular Phospho-glycoprotEin (MEPE) and proteases are elevated and PHEX is defective in HYP. PHEX prevents proteolysis of MEPE and release of a protease-resistant MEPE-ASARM peptide, an inhibitor of mineralization (minhibin). Thus, in HYP, mutated PHEX may contribute to increased ASARM peptide release. Moreover, binding of MEPE by PHEX may regulate this process in normal subjects. The nature of the PHEX-MEPE nonproteolytic interaction(s) (direct or indirect) is/are unknown. Our aims were to determine (1) whether PHEX binds specifically to MEPE, (2) whether the binding involves the ASARM motif region, and (3) whether free ASARM peptide affects mineralization in vivo in mice. Protein interactions between MEPE and recombinant soluble PHEX (secPHEX) were measured using surface plasmon resonance (SPR). Briefly, secPHEX, MEPE, and control protein (IgG) were immobilized on a Biacore CM5 sensor chip, and SPR experiments were performed on a Biacore 3000 high-performance research system. Pure secPHEX was then injected at different concentrations, and interactions with immobilized proteins were measured. To determine MEPE sequences interacting with secPHEX, the inhibitory effects of MEPE-ASARM peptides (phosphorylated and nonphosphorylated), control peptides, and MEPE midregion RGD peptides on secPHEX binding to chip-immobilized MEPE were measured. ASARM peptide and etidronate-mediated mineralization inhibition in vivo and in vitro were determined by quenched calcein fluorescence in hind limbs and calvariae in mice and by histological Sanderson stain. A specific, dose-dependent and Zn-dependent protein interaction between secPHEX and immobilized MEPE occurs (EC50 of 553 nM). Synthetic MEPE PO4-ASARM peptide inhibits the PHEX-MEPE interaction (K(D(app)) = 15 uM and B(max/inhib) = 68%). In contrast, control and MEPE-RGD peptides had no effect. Subcutaneous administration of ASARM peptide resulted in marked quenching of fluorescence in calvariae and hind limbs relative to vehicle controls indicating impaired mineralization. Similar results were obtained with etidronate. Sanderson-stained calvariae also indicated a marked increase in unmineralized osteoid with ASARM peptide and etidronate groups. We conclude that PHEX and MEPE form a nonproteolytic protein interaction via the MEPE carboxy-terminal ASARM motif, and the ASARM peptide inhibits mineralization in vivo. The binding of MEPE and ASARM peptide by PHEX may explain why loss of functional osteoblast-expressed PHEX results in defective mineralization in HYP.


Figures

Fig. 1
Fig. 1
Biacore sensorgram of chip-immobilized MEPE, PHEX, and IgG ligands against secPHEX analyte (mobile phase). PHEX binds to MEPE, and the binding requires ZnCl2 (2 mM)-supplemented buffer (HBS-P-Zn). Specifically, no PHEX–MEPE binding was observed with buffer lacking ZnCl2 and concentrations of PHEX analyte up to 10 uM (data not shown). Ligands (MEPE, PHEX, and IgG) were each coupled to a Biacore CM-5 chip at 3500 RU and 2 uM secPHEX analyte flowed through each cell for 6 min. The secPHEX, 6-minute injection pulse is indicated as a line above the sensorgram. A distinct association and dissociation curve occurred with secPHEX analyte and MEPE-immobilized ligand indicating a strong MEPE–PHEX association and binding. There was no secPHEX analyte interaction with IgG ligand and a very low level self-association with PHEX ligand and PHEX analyte (possible very low-level homodimer association).
Fig. 2
Fig. 2
Composite Biacore sensorgrams of chip-immobilized MEPE ligand against different concentrations of secPHEX analyte (mobile phase). The secPHEX binding to MEPE is dose-dependent with a distinct plateau or saturation shown at 10 uM secPHEX. The CM-5 chip was coupled with 3500 RU of proteins as indicated in Fig. 1. No interaction was detected with control proteins (IgG) on the same chip (see Fig. 1).
Fig. 3
Fig. 3
Binding of secPHEX to MEPE as calculated from data presented in Figs. 1 and 2. The same coupling of 3500 RU of protein was used. A Bmax of 680 RU and an EC50 of 553 nM were computed for secPHEX (analyte) binding to chip immobilized MEPE (ligand). Graph B presents the binding hyperbola of graph A in linear form by transform plotting of X and Y coordinates as inverse values for secPHEX–MEPE binding. The PHEX–MEPE binding is thus dose-dependent, specific, direct, and saturable.
Fig. 4
Fig. 4
Composite PO4-ASARM peptide competition Biacore sensorgrams of chip-immobilized MEPE ligand against added secPHEX analyte (mobile phase) in the presence of differing concentrations of PO4-ASARM peptide. The PO4-ASARM peptide inhibits PHEX–MEPE binding dose-dependently. MEPE ligand was coupled to the chip surface at 6000 RU to increase signal response. PHEX was then injected at a constant 250 nM with a range of concentrations of PO4-ASARM peptide. Nonphosphorylated ASARM peptide also inhibited secPHEX–MEPE binding but to a lesser extent (see Fig. 5). In contrast, the MEPE–RGD control peptide (see Table 1 for sequences) was completely ineffective at inhibiting secPHEX–MEPE binding at identical concentrations up to 83 uM (see Fig. 5A). This suggests that the ASARM motif plays a role in the secPHEX–MEPE association.
Fig. 5
Fig. 5
Solution competition of secPHEX–MEPE binding in the presence of PO4-ASARM peptide as calculated from data presented in Fig. 4, with MEPE ligand coupled to 6000 RU. A Bmax/inhib of 68% inhibition of response units (RU) and an apparent KDapp of 15 nM were computed. Graph B presents the binding hyperbola of graph A in linear form by transform plotting of X and Y coordinates as inverse values. The Bmax/inh value represents the maximal peptide-mediated percentage inhibition of PHEX–MEPE binding relative to the “nonpeptide” control (0% inhibition of binding). This was calculated using a constant analyte flow solution of 250 nM secPHEX against immobilized MEPE ligand at 6000 RU. Nonphosphorylated ASARM peptide was less effective at inhibiting the secPHEX–MEPE binding with an approximate KDapp of 35 uM compared to a KDapp of 15 uM for the phosphorylated ASARM peptide (PO4-ASARM peptide). As indicated in Fig. 4, control MEPE–RGD peptide was completely ineffective at inhibiting secPHEX–MEPE binding at identical concentrations up to 83 uM (see A). Moreover, the solution competition of the MEPE PO4-ASARM peptide was dose-dependent, specific, and saturable. This strongly suggests that the ASARM motif plays a key role in the secPHEX–MEPE association.
Fig. 6
Fig. 6
Epi-UV fluorescence imaging of undecalcified tissues; (A) calvariae and (B) tibiae and femurs from mice injected with vehicle (HEPES buffer), etidronate (10 mg/kg/day), and PO4-ASARM peptide (2 mg/kg/day) as indicated. Injections were given once a day for 12 days (except days 6 and 7), and all animals were injected with calcein (20 mg/kg/day) on days 3, 5, 9, and 11, respectively. Samples were imaged simultaneously on a large Bio-Rad imaging platen after epi-UV illumination-induced fluorescence and digital image capture (FluorMax fluor-imager imaging system). Image saturation was avoided by software monitoring (Quantity-1 software) and the captured calcein-fluorescent images quantitated by use of the same software (see Figs. 7A and B). The PO4-ASARM peptide was massively quenched compared to the vehicle group and even further quenched than the positive control, etidronate. This indicates massive mineralization impairment by the PO4-ASARM peptide and confirms the effect of etidronate demonstrated previously (references) (see Fig. 7 for fluorescence quantitation and statistics).
Fig. 7
Fig. 7
Quantitation of whole-fluorescent imaging as depicted in Fig. 6 by use of Bio-Rad Quantity 1 software. Both the PO4-ASARM peptide and etidronate groups had significant and markedly quenched fluorescence with fluorescent intensity units of 568.7 (SEM = 80.2; N = 5; P < 0.01) and 417.7 (SEM = 48.3; N = 5; P < 0.001), respectively, compared to the vehicle group at 1100.5 (SEM = 132.8; N = 5). This represents a percentage quenching of 48.4% (P < 0.01) for etidronate and 62% (P < 0.001) for the PO4-ASARM peptide, respectively. Graph B illustrates a similar quenching with tibiae-femurs and PO4-ASARM peptide group fluorescent intensity of 148.9 (SEM = 15.1; N = 5; P < 0.01) relative to the vehicle at 268.52 (SEM = 26.8; N = 5). This corresponds to a PO4-ASARM peptide-mediated fluorescence-signal reduction of 44.5% (P < 0.01). Thus, the PO4-ASARM peptide is an even more effective inhibitor of fluorescence and thus mineralization than the positive control, etidronate.
Fig. 8
Fig. 8
Representative photomicrographs of plastic-embedded, undecalcified mice calvariae from Figs. 6 and 7. Slides were analyzed under fluorescent microscope at 200×, and the calcein fluorescence was captured by digital camera. The control group (vehicle) clearly shows four lamellar fluorescent layers corresponding to the four calcein injections (20 mg/kg/day) given on days 3, 5, 9, and 11, respectively. The characteristic and distinct lamellar fluorescent bands were completely absent from the PO4-ASARM peptide groups as well as in the group treated with etidronate, again indicating impairment of mineralization with the positive control (etidronate) and experimental groups (PO4-ASARM-peptide).
Fig. 9
Fig. 9
Corresponding Sanderson staining of representative mice calvariae, undecalcified cross-sections (×200), embedded in plastic as described for Fig. 8. Mineralized bone stains pink and nonmineralized osteoid stains blue. The darker staining osteoid is clearly visible in grayscale on the upper surface of each sample (A, B, and C) and is highlighted with arrows in C. The osteoid thickness in the etidronate (B) and PO4-ASARM peptide (C) groups were significantly greater than the vehicle group (A). The inset histogram graphically illustrates the marked increase in thickness and thus impaired mineralization in groups B (etidronate) and C (PO4-ASARM peptide), with relative thicknesses of 5.4 (SEM = 0.29; N = 3; P < 0.05) and 8.0 (SEM = 0.57; N = 3; P < 0.001), respectively, compared to vehicle (A) at 2.3 (SEM = 0.33; N = 3 ). This is consistent with the data shown in Figs. 6, 7, and 8. Measurements were made from the exact same area (suture) in all three groups.
Fig. 10
Fig. 10
This figure depicts a simplified scheme describing the ASARM model. The model is discussed in more detail in a recent review [68]. Also, an animated flash scheme of the ASARM model can be accessed at the following Web site (http://www.periodontics.uthscsa.edu/rowe/asarm-modelandfgf23.html). The letters in the cartoon (a to k) are reference points for text descriptions. Full-length FGF23 is the active form of the molecule. The primary physiological tissue(s) and sites of FGF23 expression are uncertain and could involve bone and/or extraosseous sites (a) [27,39,40,97]. Inactivation of FGF23 (b) is thought to occur through the action of proprotein convertases and not PHEX [4,51]. Autosomal dominant hypophosphatemic rickets (ADHR) is due to activating mutations in FGF23 that increase half-life of the phosphaturic full-length form (a). FGF23 is a potent down-regulator of 1-α-hydroxylase expression (c) and up-regulates the catabolic enzyme 24-hydroxylase (d) [79]. This results in suppression of serum 1,25 vitamin D levels (e) [79]. Indeed, the effects mediated by full-length FGF23 on vitamin D metabolism are more marked than the direct effects on phosphate handling in vivo [79]. Also, 1,25 vitamin D3 suppresses expression of MEPE (f) [2,59,71]. Thus, suppression of 1,25 vitamin D3 levels by FGF23 will in turn increase expression of MEPE (g). We provide evidence in this paper and a previous publication [27] that MEPE reversibly interacts with PHEX, and this interaction protects MEPE from proteolysis (h). Also, the ASARM motif plays a major role in the PHEX–MEPE interaction (h). In Hyp, PHEX is defective [29,70,73] and cannot bind to MEPE and/or protect the molecule from proteolysis. The FGF23 levels in Hyp are elevated, serum 1,25 vitamin D3 is suppressed, osteoblastic MEPE expression is elevated, and the levels of osteoblastic proteases are also markedly elevated (i) [2,3,17,27,32,33, 39,89]. The increased MEPE and protease levels result in increased proteolysis of MEPE and release of the protease resistant ASARM peptide (j). This is compounded by loss of protease protection due to defective PHEX (h). The ASARM peptide in turn inhibits mineralization and renal phosphate handling and is wholly or in part responsible for the hypophosphatemia and rickets/osteomalacia (k). Further evidence for a key MEPE role in phosphate metabolism and mineralization is the finding that MEPE serum levels are 450 ng/ml up to 1.6 Ag/ml in normal subjects, and the levels are tightly correlated with serum phosphorus, PTH, bone mineral density (BMD), and FGF23 [30,39]. Moreover, MEPE is phosphaturic in vivo and in vitro, and the ASARM peptide may play a key role [14,71]. Of additional interest, MEPE expression is down-regulated by FGF2, a cytokine involved in bone formation [98].

References

    1. Aisa MC, Beccari T, Costanzi E, Maggio D. Cathepsin B in osteoblasts. Biochim Biophys Acta. 2003;1621:149–159. - PubMed
    1. Argiro L, Desbarats M, Glorieux FH, Ecarot B. Mepe, the gene encoding a tumor-secreted protein in oncogenic hypophosphatemic osteomalacia, is expressed in bone. Genomics. 2001;74:342–351. - PubMed
    1. Bai X, Miao D, Panda D, Grady S, McKee MD, Goltzman D, et al. Partial rescue of the Hyp phenotype by osteoblast-targeted PHEX (phosphate-regulating gene with homologies to endopeptidases on the X chromosome) expression. Mol Endocrinol. 2002;16:2913–2925. - PubMed
    1. Benet-Pages A, Lorenz-Depiereux B, Zischka H, White KE, Econs TM, Strom TM. FGF23 is processed by proprotein convertases but not by PHEX. Bone. 2004;35:455–462. - PubMed
    1. Bianchetti L, Oudet C, Poch O. M13 endopeptidases: new conserved motifs correlated with structure, and simultaneous phylogenetic occurrence of PHEX and the bony fish. Proteins. 2002;47:481–488. - PubMed

Publication types

MeSH terms