. 2005 Feb 1;102(5):1324-8.
doi: 10.1073/pnas.0409409102. Epub 2005 Jan 21.

Iron release from macrophages after erythrophagocytosis is up-regulated by ferroportin 1 overexpression and down-regulated by hepcidin

Affiliations

Iron release from macrophages after erythrophagocytosis is up-regulated by ferroportin 1 overexpression and down-regulated by hepcidin

Mitchell D Knutson et al. Proc Natl Acad Sci U S A. .

Abstract

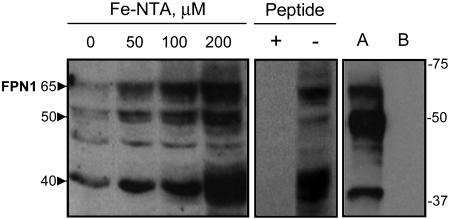
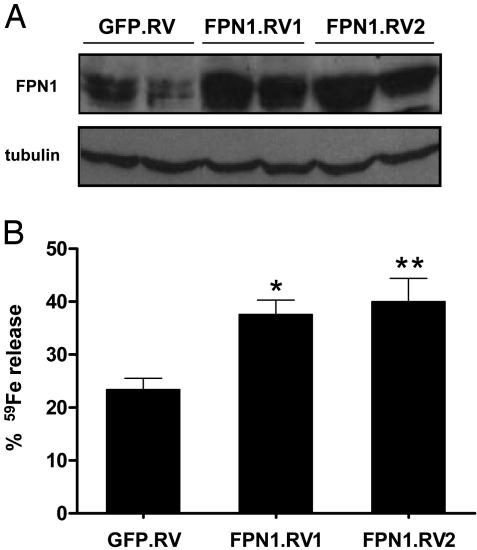
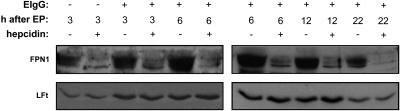
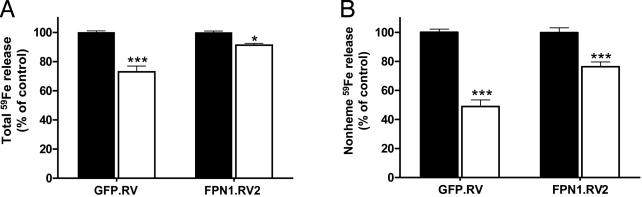
Ferroportin 1 (FPN1) is transmembrane protein involved in iron homeostasis. In the duodenum, FPN1 localizes to the basolateral surface of enterocytes where it appears to export iron out of the cell and into the portal circulation. FPN1 is also abundantly expressed in reticuloendothelial macrophages of the liver, spleen, and bone marrow, suggesting that this protein serves as an iron exporter in cells that recycle iron from senescent red blood cells. To directly test the hypothesis that FPN1 functions in the export of iron after erythrophagocytosis, FPN1 was stably expressed in J774 mouse macrophages by using retroviral transduction, and release of 59Fe after phagocytosis of 59Fe-labeled rat erythrocytes was measured. J774 cells overexpressing FPN1 released 70% more 59Fe after erythrophagocytosis than control cells, consistent with a role in the recycling of iron from senescent red cells. Treatment of cells with the peptide hormone hepcidin, a systemic regulator of iron metabolism, dramatically decreased FPN1 protein levels and significantly reduced the efflux of 59Fe after erythrophagocytosis. Subsequent fractionation of the total released 59Fe into heme and nonheme compounds revealed that hepcidin treatment reduced the release of nonheme 59Fe by 50% and 25% from control and FPN1-overexpressing cells, respectively, but did not diminish efflux of 59Fe-heme. We conclude that FPN1 is directly involved in the export of iron during erythrocyte-iron recycling by macrophages.


Figures

Fig. 1.
Fig. 1.
Characterization of the immunoreactivity of affinity-purified anti-FPN1 peptide antibody. J774 cells were treated with 0-200 μM ferric-nitrilotriacetic acid for 48 h. Cell lysates (60 μg of protein per lane) were electrophoresed on a 10% SDS-polyacrylamide gel, transferred to nitrocellulose, and blotted with anti-FPN1 antibody as described in Materials and Methods. The position and masses (in kDa) of molecular weight markers are indicated on the right. The approximate molecular masses (kDa) of the main iron-responsive immunoreactive bands are indicated by arrowheads on the left. To confirm specificity of antiserum by peptide competition, lysates from J774 cells treated with 200 μM ferric-nitrilotriacetic acid for 48 h were blotted with anti-FPN1 antibody preincubated for 1 h in the presence (+) or absence (-) of a 100-fold molar excess of FPN1 peptide. In addition, lysates (15 μg per lane) were analyzed from HEK292T cells transfected with pSport2 CMV vector containing full-length mouse FPN1 cDNA (lane A) or pSport2 CMV vector alone (lane B). Ponceau staining indicated equivalent protein loading among lanes (not shown).
Fig. 2.
Fig. 2.
Overexpression of FPN1 by retroviral transduction increases the release of 59Fe after phagocytosis of 59Fe-lableled red blood cells. (A) J774 cells were transduced with retroviral vectors containing GFP (GFP.RV) or GFP plus FPN1 (FPN1.RV), and GFP-expressing cells were selected by flow cytometry. Individual clones overexpressing FPN1 (FPN1.RV1 and FPN1.RV2) were subsequently identified by Western analysis. Cell lysates (120 μg of protein per lane) were blotted with anti-FPN1 antibody as described for Fig. 1. (A) Results from two different cell lysates, obtained on different days, from each of the three groups. As a control for lane loading, the blot was stripped and reprobed for tubulin. (B) J774 macrophages were incubated with 59Fe-EIgG for 1.5 h. After removal of noningested 59Fe-EIgG, cells were incubated for 22 h. Supernatant and cell fractions were collected and cpm determined by gamma counting. Percentage of iron release was calculated as [(cpm in supernatant)/(cpm in supernatant + cpm cells)] × 100. Each bar represents the mean ± SEM of five independent experiments performed in triplicate. Asterisks indicate a difference from GFP.RV: *, P < 0.05; **, P < 0.01.
Fig. 3.
Fig. 3.
Hepcidin treatment markedly decreases FPN1 protein levels but does not affect light-chain ferritin (LFt) levels after erythrophagocytosis (EP). FPN1.RV2 J774 cells were incubated with or without EIgG for 1.5 h. After removal of noningested EIgG, macrophages were treated with or without 700 nM hepcidin and incubated for 3-6 h (Left) or 6-22 h (Right). Cell lysates (60 μg and 30 μg per lane) were blotted with anti-FPN1 antibody and anti-ferritin antiserum, respectively.
Fig. 4.
Fig. 4.
Hepcidin treatment decreases the release of nonheme 59Fe after phagocytosis of 59Fe-labeled red blood cells. (A) GFP.RV and FPN1.RV2 J774 cells were incubated with EIgG for 1.5 h. After removal of noningested EIgG, macrophages were treated with 700 nM hepcidin (open bars) or an equal amount of sterile water as control (solid bars), and the release of 59Fe after 22 h was determined as described in the legend of Fig. 2. (B) The percentage of total 59Fe released as nonheme 59Fe was determined after extracting the supernatant media with cyclohexanone to remove 59Fe-heme. To account for day-to-day variability in red cell preparations and erythrophagocytic activity, results are shown as relative differences of 59Fe release as compared to the untreated control (100%). Data are expressed as means ± SEM for three independent experiments, performed in triplicate. Asterisks indicate a difference from respective untreated controls: *, P < 0.05; **, P < 0.01; ***, P < 0.001.

Similar articles

Cited by

References

    1. Knutson, M. & Wessling-Resnick, M. (2003) Crit. Rev. Biochem. Mol. Biol. 38, 61-88. - PubMed
    1. Abboud, S. & Haile, D. J. (2000) J. Biol. Chem. 275, 19906-19912. - PubMed
    1. Donovan, A., Brownlie, A., Zhou, Y., Shepard, J., Pratt, S. J., Moynihan, J., Paw, B. H., Drejer, A., Barut, B., Zapata, A., et al. (2000) Nature 403, 776-781. - PubMed
    1. McKie, A. T., Marciani, P., Rolfs, A., Brennan, K., Wehr, K., Barrow, D., Miret, S., Bomford, A., Peters, T. J., Farzaneh, F., et al. (2000) Mol. Cell 5, 299-309. - PubMed
    1. Yang, F., Liu, X. B., Quinones, M., Melby, P. C., Ghio, A. & Haile, D. J. (2002) J. Biol. Chem. 277, 39786-39791. - PubMed

Publication types