

Metabolic engineering of dhurrin in transgenic Arabidopsis plants with marginal inadvertent effects on the metabolome and transcriptome
- PMID: 15665094
- PMCID: PMC545087
- DOI: 10.1073/pnas.0409233102
Metabolic engineering of dhurrin in transgenic Arabidopsis plants with marginal inadvertent effects on the metabolome and transcriptome
Abstract
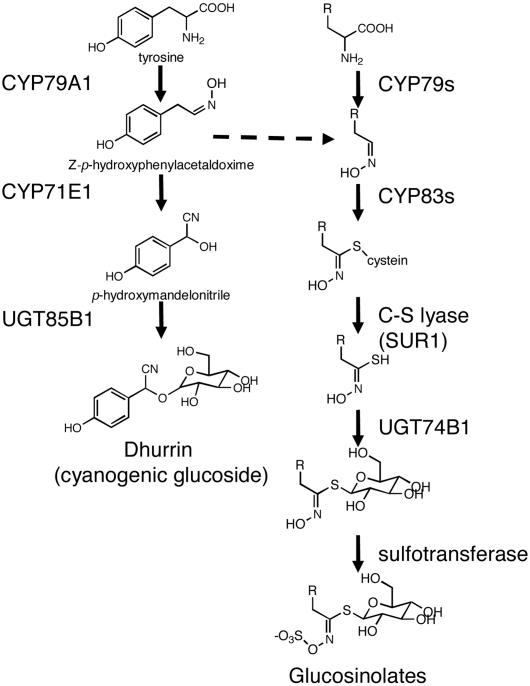
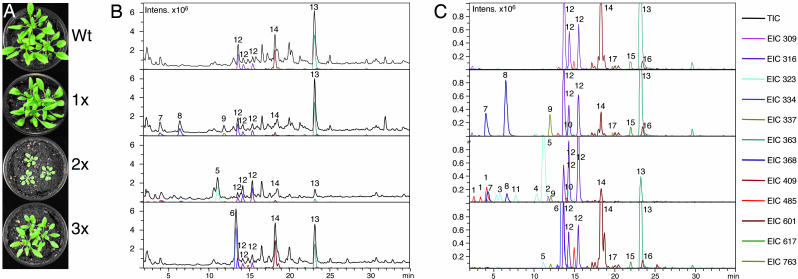
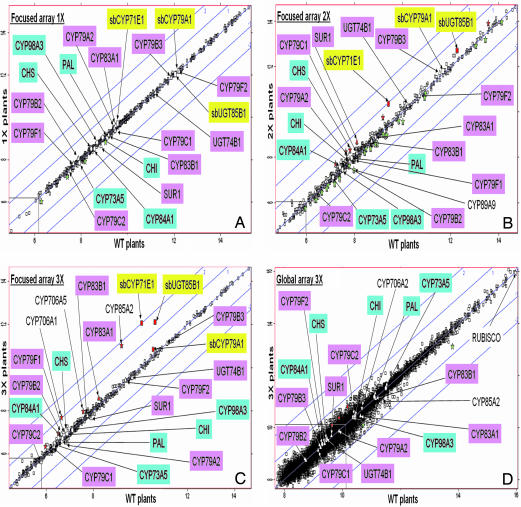
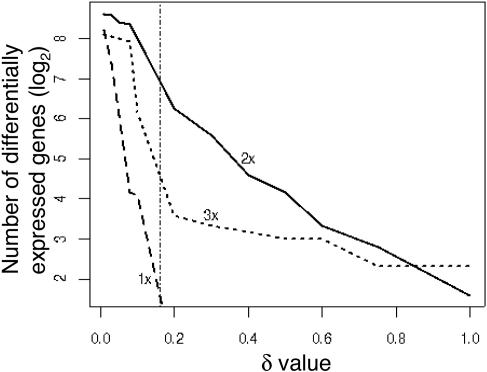
Focused and nontargeted approaches were used to assess the impact associated with introduction of new high-flux pathways in Arabidopsis thaliana by genetic engineering. Transgenic A. thaliana plants expressing the entire biosynthetic pathway for the tyrosine-derived cyanogenic glucoside dhurrin as accomplished by insertion of CYP79A1, CYP71E1, and UGT85B1 from Sorghum bicolor were shown to accumulate 4% dry-weight dhurrin with marginal inadvertent effects on plant morphology, free amino acid pools, transcriptome, and metabolome. In a similar manner, plants expressing only CYP79A1 accumulated 3% dry weight of the tyrosine-derived glucosinolate, p-hydroxybenzylglucosinolate with no morphological pleitropic effects. In contrast, insertion of CYP79A1 plus CYP71E1 resulted in stunted plants, transcriptome alterations, accumulation of numerous glucosides derived from detoxification of intermediates in the dhurrin pathway, and in loss of the brassicaceae-specific UV protectants sinapoyl glucose and sinapoyl malate and kaempferol glucosides. The accumulation of glucosides in the plants expressing CYP79A1 and CYP71E1 was not accompanied by induction of glycosyltransferases, demonstrating that plants are constantly prepared to detoxify xenobiotics. The pleiotrophic effects observed in plants expressing sorghum CYP79A1 and CYP71E1 were complemented by retransformation with S. bicolor UGT85B. These results demonstrate that insertion of high-flux pathways directing synthesis and intracellular storage of high amounts of a cyanogenic glucoside or a glucosinolate is achievable in transgenic A. thaliana plants with marginal inadvertent effects on the transcriptome and metabolome.
Figures
References
-
- Hughes, E. H. & Shanks, J. V. (2002) Metab. Eng. 4, 41–48. - PubMed
-
- Verpoorte, R. & Memelink, J. (2002) Curr. Opin. Biotechnol. 13, 181–187. - PubMed
-
- Morant, M., Bak, S., Møller, B. L. & Werck-Reichhart, D. (2003) Curr. Opin. Biotechnol. 14, 151–162. - PubMed
-
- Tattersall, D. B., Bak, S., Jones, P. R., Olsen, C. E., Nielsen, J. K., Hansen, M. L., Høj, P. B. & Møller, B. L. (2001) Science 293, 1826–1828. - PubMed
-
- Bak, S., Olsen, C. E., Petersen, B. L., Møller, B. L. & Halkier, B. A. (1999) Plant J. 20, 663–672. - PubMed
Publication types
MeSH terms
Substances
LinkOut - more resources
Full Text Sources
Other Literature Sources
Molecular Biology Databases
