. 2005 Feb 1;102(5):1408-12.
doi: 10.1073/pnas.0406787102. Epub 2005 Jan 21.

Gating of acetylcholine receptor channels: brownian motion across a broad transition state

Affiliations

Gating of acetylcholine receptor channels: brownian motion across a broad transition state

Anthony Auerbach. Proc Natl Acad Sci U S A. .

Abstract

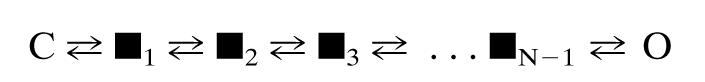
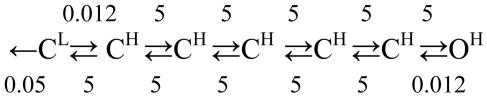
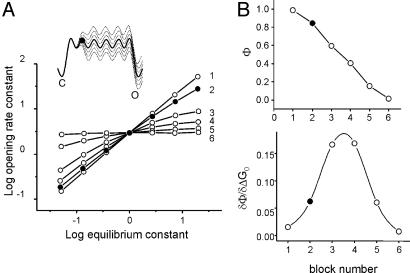
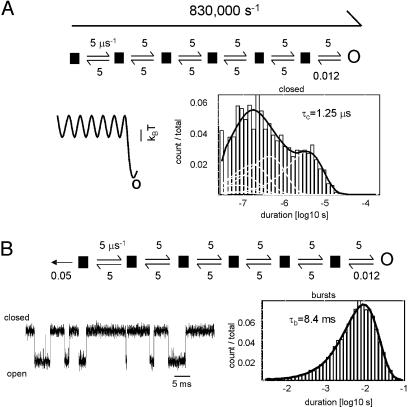
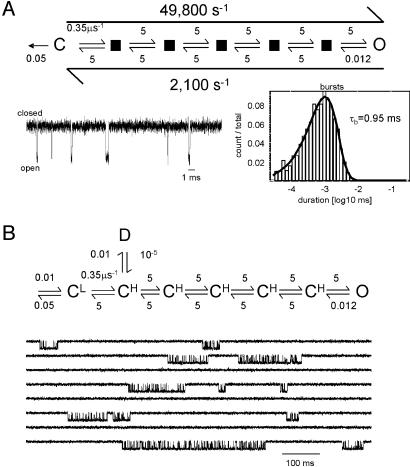
Acetylcholine receptor channels (AChRs) are proteins that switch between stable "closed" and "open" conformations. In patch clamp recordings, diliganded AChR gating appears to be a simple, two-state reaction. However, mutagenesis studies indicate that during gating dozens of residues across the protein move asynchronously and are organized into rigid body gating domains ("blocks"). Moreover, there is an upper limit to the apparent channel opening rate constant. These observations suggest that the gating reaction has a broad, corrugated transition state region, with the maximum opening rate reflecting, in part, the mean first-passage time across this ensemble. Simulations reveal that a flat, isotropic energy profile for the transition state can account for many of the essential features of AChR gating. With this mechanism, concerted, local structural transitions that occur on the broad transition state ensemble give rise to fractional measures of reaction progress (Phi values) determined by rate-equilibrium free energy relationship analysis. The results suggest that the coarse-grained AChR gating conformational change propagates through the protein with dynamics that are governed by the Brownian motion of individual gating blocks.


Figures

Scheme 1.
Scheme 1.
The end states, C and O, represent the protein with all gating blocks either resting or active, respectively. ▪ represents a microstate in which some blocks are resting and others are active. N is the number of gating blocks (Nstates - 1). All states shown represent fully liganded AChRs.
Scheme 2.
Scheme 2.
The rate constants are in μs-1. The C states have a nonconducting pore but either CL or CH transmitter-binding sites.
Fig. 4.
Fig. 4.
Simulation of REFERs. (A) Starting with the intrinsic gating energy profile (Fig. 1), each microstate isomerization equilibrium constant was perturbed by ±3 kBT and the resulting apparent rate and equilibrium constants for the overall reaction were plotted in log–log format. Only the final O state was conducting. (Inset) The energy profiles are for the intrinsic reaction (thick line) and for the perturbation series of the second microstate transition (dashed lines). In all simulations, the apparent C and O interval durations were well fitted by a single exponential function. The numbers next to each REFER indicate the microstate transition (i.e., block isomerization) that was perturbed. The second block isomerization is shown as a filled circle throughout. (B) The first (Φ) and second (δΦ/δΔG0) derivatives of the REFERs shown in A. (Upper) Φ values span 0–1. (Bottom) The curvature of the REFER is maximal near the midpoint of the overall reaction. Concerted (blockwise) isomerizations that occur on a broad, corrugated transition-state region produce fractional apparent Φ values and negative (Hammond) curvatures for the overall reaction. For all simulations, the sampling interval was 10 μs, the dead time was 25 μs, and all interval duration distributions were well described by a single exponential.
Fig. 1.
Fig. 1.
Simulation of intrinsic gating. Intrinsic gating is defined as the condition of having equal apparent opening and closing rate constants (i.e., Θ = 1). In experiments with perturbations of the first gating block, intrinsic AChR gating is satisfied when the rate constant is ≈2,000 s-1. (Top Left) The simulated reaction scheme had two stable end states (C and O) plus five transient microstates (▪). With N = 6 and λ = 5 μs-1 (Scheme 1 and Eq. 2), the simulated apparent rate constant was ≈2,000 s-1 (long arrows). This rate constant was insensitive to the conductance class of the microstates. (Top Right) The corresponding free energy profile. (Middle) A simulated current trace. The sampling interval was 10 μs and the dead time was 25 μs. (Bottom) The apparent C and O dwell-time histograms and densities fitted by a two-state C⇄O model. The short-lived nonconducting components that are generated by the reaction scheme are not visible because they were too brief to be detected.
Fig. 2.
Fig. 2.
Simulations of speed-limit gating. Speed-limit gating is defined as the condition in which there is no net activation barrier. In experiments with αD97 mutants, speed-limit gating occurs when the burst duration reached an asymptote (≈7.0 ms). This estimate may correspond to an apparent opening rate constant of ≈0.86 μs-1 (≈1.2-μs mean first passage time across the transition state ensemble). (A) The mean first passage time simulated by using a scheme with all transition states being nonconducting and with N = 6 and λ = 5 μs-1 is 1.25 μs. (Lower Right) The corresponding C interval duration histogram and density. The sampling interval was 10 ns and the dead time was 25 ns. (B) Incorporating ligand dissociation (50,000 s-1) from the first nonconducting state results in bursts that have a mean duration (τb) that is modestly greater than the experimentally determined asymptote. The brief gaps in the current trace are also apparent in experimental records and reflect occasional, long-lived sojourns along the transition-state ensemble.
Fig. 3.
Fig. 3.
Simulations of physiological gating. (A) Activation by the natural transmitter ACh. The rate constants of the stable C state (C) reflect dissociation (left arrow, 50,000 s-1) and the activation of the first gating block (right arrow, 350,000 s-1). The rate constants that are apparent in the simulations (long arrows) are close to the experimentally observed values (48,000 s-1 and 1,700 s-1, respectively). (Lower Left) The example currents. The sampling interval was 10 μs, and the dead time was 25 μs. (Bottom) Histograms of C, O, and burst durations. The simulated burst duration (τb) is close to the experimentally observed value (1.2 ms). (B) Desensitization. (Upper) The reaction scheme shown in A was modified by adding a long-lived state connected to the first, high-affinity/nonconducting intermediate of the transition state ensemble (see Scheme 2) by a rate constant of 10,000 s-1. (Lower) The simulated currents resemble experimentally observed clusters of openings. In principle, desensitization could arise from a process operating on one or more of the microstates of the gating reaction.

Similar articles

Cited by

References

    1. Doyle, D. A., Morais Cabral, J., Pfuetzner, R. A., Kuo, A., Gulbis, J. M., Cohen, S. L., Chait, B. T. & MacKinnon, R. (1998) Science 280, 69-77. - PubMed
    1. Jiang, Y., Lee, A., Chen, J., Cadene, M., Chait, B. T. & MacKinnon, R. (2002) Nature 417, 523-526. - PubMed
    1. Miyazawa, A., Fujiyoshi, Y. & Unwin, N. (2003) Nature 424, 949-955. - PubMed
    1. Liu, Y. S., Sompornpisut, P. & Perozo, E. (2001) Nat. Struct. Biol. 8, 883-887. - PubMed
    1. Karlin, A. (2002) Nat. Rev. Neurosci. 3, 102-114. - PubMed

MeSH terms

LinkOut - more resources