. 2005 Apr;88(4):2883-96.
doi: 10.1529/biophysj.104.049155. Epub 2005 Jan 21.

Role of actin DNase-I-binding loop in myosin subfragment 1-induced polymerization of G-actin: implications for the mechanism of polymerization

Affiliations

Role of actin DNase-I-binding loop in myosin subfragment 1-induced polymerization of G-actin: implications for the mechanism of polymerization

Barbara Wawro et al. Biophys J. 2005 Apr.

Abstract

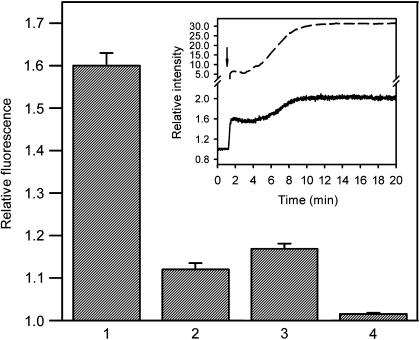
Proteolytic cleavage of actin between Gly(42) and Val(43) within its DNase-I-binding loop (D-loop) abolishes the ability of Ca-G-actin to spontaneously polymerize in the presence of KCl. Here we show that such modified actin is assembled into filaments, albeit at a lower rate than unmodified actin, by myosin subfragment 1 (S1) carrying the A1 essential light chain but not by S1(A2). S1 titration of pyrene-G-actin showed a diminished affinity of cleaved actin for S1, but this could be compensated for by using S1 in excess. The most significant effect of the cleavage, revealed by measuring the fluorescence of pyrene-actin and light-scattering intensities as a function of actin concentration at saturating concentrations of S1, is strong inhibition of association of G-actin-S1 complexes into oligomers. Measurements of the fluorescence of dansyl cadaverine attached to Gln(41) indicate substantial inhibition of the initial association of G-actin-S1 into longitudinal dimers. The data provide experimental evidence for the critical role of D-loop conformation in both longitudinal and lateral, cross-strand actin-actin contact formation in the nucleation reaction. Electron microscopic analysis of the changes in filament-length distribution during polymerization of actin by S1(A1) and S1(A2) suggests that the mechanism of S1-induced polymerization is not substantially different from the nucleation-elongation scheme of spontaneous actin polymerization.


Figures

FIGURE 1
FIGURE 1
Sodium dodecyl sulfate polyacrylamide gel electrophoresis of the protein preparations used throughout this work. (a and b) S1(A2) and S1(A1), respectively; electrophoresis on a 15% (mass/vol) gel slab. (c and d) Unmodified and ECP-cleaved actin, respectively; electrophoresis on a 12% gel slab. The fast-migrating N-terminal fragment of ECP-cleaved actin is not visualized under these conditions. The pattern of ECP cleavage of pyrene- or DC-labeled actin (not shown) did not differ from that of unmodified actin.
FIGURE 2
FIGURE 2
ECP-cleaved G-actin requires tightly bound Mg2+ for both the nucleation and filament elongation step of salt-induced polymerization. (A) At time zero, ECP-cleaved Ca-G-actin (24 μM) was supplemented with 0.1 M KCl (curve 1) or with 0.1 M KCl and 0.25 μM phalloidin-stabilized F-actin seeds (see Materials and Methods) (curve 2) and light-scattering intensity was measured at 25°C. (Curve 3) ECP-cleaved Ca-G-actin was incubated with 0.1 M KCl for 1 h and then, at time zero, was supplemented with 0.2 mM EGTA/50 μM MgCl2 to replace tightly bound Ca2+ with Mg2+. (Curves 4 and 5) ECP-cleaved Mg-G-actin supplemented at time zero with 0.1 M KCl alone or combined with 0.25 μM F-actin seeds, respectively. (Curve 6) intact Mg-G-actin with 0.1 M KCl added at time zero. (B) ECP-cleaved Ca-G-actin (○) or Mg-G-actin (•), both 24 μM, were incubated at 25°C with 0.1 M KCl added at time zero. ATP hydrolysis was monitored by determining the released Pi using the method of Kodama et al. (1986).
FIGURE 3
FIGURE 3
Comparison of S1-induced polymerization of ECP-cleaved and unmodified Ca-G-actin. At time zero, 15 μM (final concentration) 75% pyrene-labeled ECP-cleaved Ca-G-actin (curves 1 and 2) or intact Ca-G-actin (curves 3 and 4) was supplemented with 22.5 μM S1(A2) (curves 1 and 3) or S1(A1) (curves 2 and 4). Intensity of scattered light (A) and of pyrene fluorescence (B) were measured in parallel samples at 25°C. The possible courses of the initial increase in fluorescence intensity occurring within the time of mixing are marked with dotted lines.
FIGURE 4
FIGURE 4
Electron micrographs of negatively stained assemblies formed by Ca-G-actin complexed with myosin subfragment 1 isoforms S1(A1) and S1(A2). Five μM intact actin (A and B) or 10 μM ECP-cleaved actin (C–E) were combined with S1(A1) (A and C) or S1(A2) (B, D, and E) added in a twofold molar excess, in buffer G. In E, 0.1 M KCl was added together with S1(A2). The progress of S1-induced polymerization of actin was monitored by measuring the intensity of scattered light at 25°C. Samples of the solutions were negatively stained after the final, constant level of light-scattering intensity was reached. The bar corresponds to 200 nm.
FIGURE 5
FIGURE 5
Changes in the excitation spectrum of pyrene-actin, associated with S1(A1)-induced polymerization of ECP-cleaved (A) and unmodified Ca-G-actin (B). Fluorescence excitation and emission spectra of 15 μM 75% pyrene-labeled actin were recorded at 25°C, before (curves 1 and 2) and after (curves 1′ and 2′) polymerization induced by addition of 30 μM S1(A1). The excitation spectra (left) were recorded at 407 nm, and the emission spectra (right) were obtained after excitation at 365 nm.
FIGURE 6
FIGURE 6
Formation of initial complexes between myosin subfragment-1 and ECP-cleaved (A) and unmodified (B) Ca-G-actin. Pyrene-labeled (20%) ECP-cleaved and unmodified Ca-G-actin at final concentrations of 3 μM and 1 μM, respectively, were titrated with S1(A1) (○) or S1(A2) (□), as described in the Materials and Methods section, at 25°C. The initial concentration of free ATP (introduced with actin) was 8.4 μM. F0 and F denote the fluorescence of pyrene-G-actin and of the pyrene-G-actin-S1 complexes, respectively.
FIGURE 7
FIGURE 7
Influence of ECP cleavage on the S1(A1)- and S1(A2)-induced changes in the fluorescence of DC-labeled actin. Fluorescence intensity was recorded before and immediately after mixing of 1 μM intact Ca-G actin (1 and 2) or ECP-cleaved actin (3 and 4) (80% DC-labeled, in buffer G containing 19 μM ATP) with a twofold molar excess of S1(A1) (1 and 3) or S1(A2) (2 and 4). The inset shows the time courses of changes in DC fluorescence (solid line) and in light-scattering intensity at 450 nm (dashed line) associated with polymerization of 1 μM DC-labeled intact Ca-G actin by 2 μM S1(A1), at 25°C. The initial intensities of the fluorescence and light scattering of actin were normalized to 1.
FIGURE 8
FIGURE 8
Dependence of S1-induced oligomer formation and polymerization of intact and ECP-cleaved Ca-G-actin on actin concentration. (A and B) Unmodified Ca-G-actin (solid symbols) and ECP-cleaved Ca-G-actin (open symbols) at the final concentrations indicated on the abscissa were mixed with S1(A1) (•, ○) or S1(A2) (▪, □) added in a twofold molar excess, and the intensity of pyrene fluorescence (A, 71% pyrene-labeled actin) or scattered light (B, unlabeled actin) was measured at 25°C immediately (∼5 s) after mixing of the proteins. The fluorescence or light-scattering intensity of actin alone is indicated by the dashed lines. The dotted line in B is for the intensity of light scattered by S1 alone. The initial concentration of free ATP in the mixtures was 65 μM. (C) Unmodified Ca-G-actin (•) and ECP-cleaved Ca-G-actin (○) at the final concentrations indicated on the abscissa were mixed with S1(A1) in a twofold molar excess over actin and allowed to polymerize at 25°C, and the final values of light-scattering intensity were measured. All samples initially contained free ATP in an 8.5-fold molar excess over actin.
FIGURE 9
FIGURE 9
Effects of 0.1 M KCl and of substitution of Mg2+ for the tightly bound Ca2+ on the ability of ECP-cleaved (A) and unmodified (B) actin to polymerize in the presence of S1(A2). At time zero, 15 μM (final concentration) Ca-G-actin was supplemented with 30 μM S1(A2) alone (curve 1), S1(A2) and 0.1 M KCl added one after another (curve 3), or S1(A1) (curve 4), and changes in the intensity of scattered light were recorded at 25°C. In parallel samples, Ca-G-actin was converted into Mg-G-actin and the light-scattering intensity was measured after addition of 30 μM S1(A2) (curve 2) or S1(A1) (curve 5).
FIGURE 10
FIGURE 10
Electron micrographs of decorated filaments formed during S1-induced polymerization of Ca-G-actin. Polymerization of 5 μM Ca-G-actin (intact) was initiated by addition of 10 μM S1(A1) (graph a and panels A–C) or S1(A2) (graph b and panels D–F). The polymerization was followed as a function of time by measuring the light-scattering intensity at 25°C. At times indicated with arrows, aliquots of the solutions were withdrawn and negatively stained with uranyl acetate as described in Materials and Methods. Graph c and panels G and H show time courses of polymerization and electron micrographs, respectively, of 1 μM intact Ca-G-actin (curve G and panel G) and 10 μM ECP-cleaved Ca-G-actin (curve H and panel H) polymerized by two equivalents of S1(A1). The bar corresponds to 200 nm.
FIGURE 11
FIGURE 11
Filament length distribution at various stages of polymerization of 5 μM intact Ca-G-actin by 10 μM S1(A1) (A–C) or S1(A2) (D–F). A–C correspond to time points A, B, and C indicated in Fig. 10 a, and panels D–F refer to time points D, E, and F in Fig. 10 b. The filament lengths were measured as described in Materials and Methods.

Similar articles

Cited by

References

    1. Blanchoin, L., S. Fievez, F. Travers, M.-F. Carlier, and D. Pantaloni. 1995. Kinetics of the interaction of myosin subfragment-1 with G-actin. Effect of nucleotides and DNaseI. J. Biol. Chem. 270:7125–7133. - PubMed
    1. Carlier, M.-F. 1991. Actin: protein structure and filament dynamics. J. Biol. Chem. 266:1–4. - PubMed
    1. Carlier, M.-F., and D. Pantaloni. 1997. Control of actin dynamics in cell motility. J. Mol. Biol. 269:459–467. - PubMed
    1. Carlier, M.-F., D. Pantaloni, and E. D. Korn. 1986. Fluorescence measurements of the binding of cations to high-affinity and low-affinity sites on ATP-G-actin. J. Biol. Chem. 261:10778–10784. - PubMed
    1. Chen, T., M. Heigentz, and E. Reisler. 1992. Myosin subfragment-1 and structural elements of G-actin: effects of S-1(A2) on sequences 39–52 and sequences 61–69 in subdomain-2 of G-actin. Biochemistry. 31:2941–2946. - PubMed

Publication types

MeSH terms

LinkOut - more resources