

Paradoxical loss of excitation with high intensity pulses during electric field stimulation of single cardiac cells
- PMID: 15665123
- PMCID: PMC1305396
- DOI: 10.1529/biophysj.104.047142
Paradoxical loss of excitation with high intensity pulses during electric field stimulation of single cardiac cells
Abstract
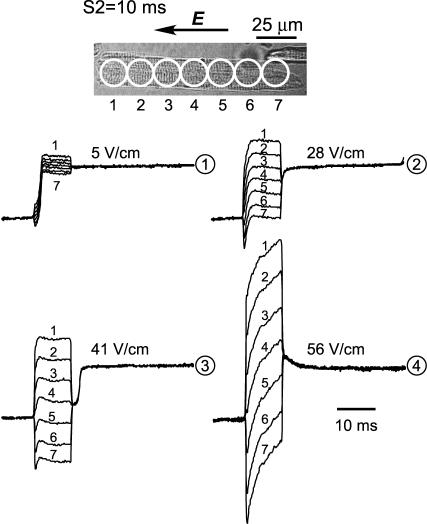
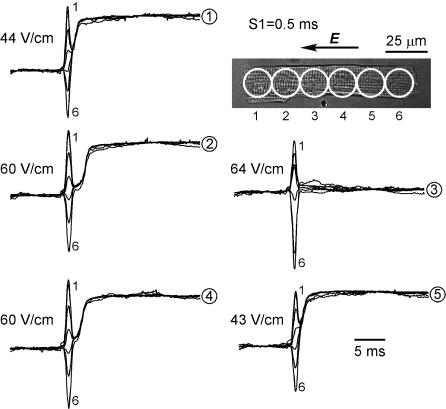
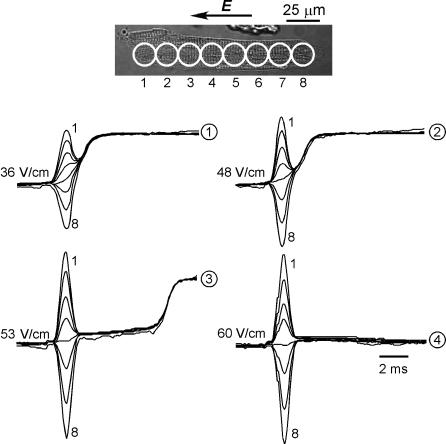
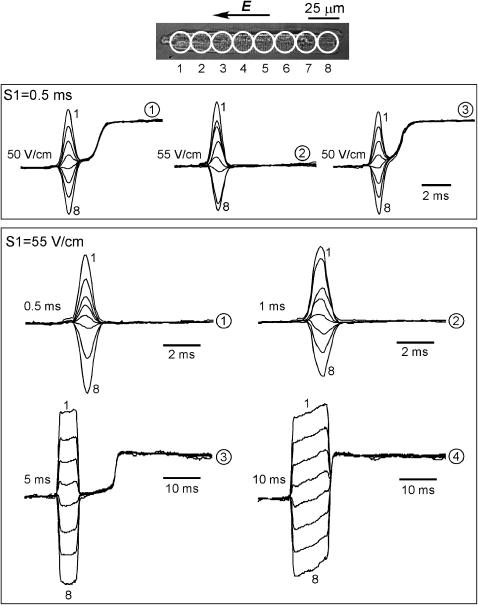
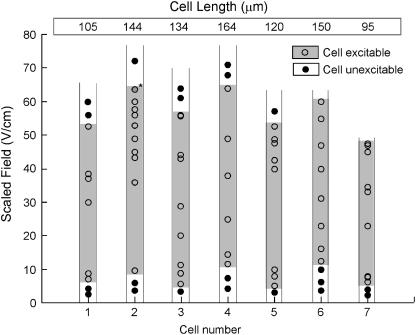
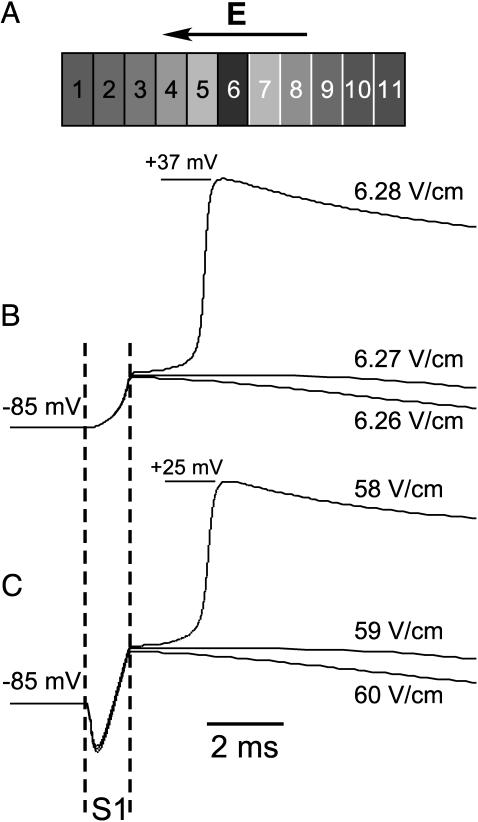
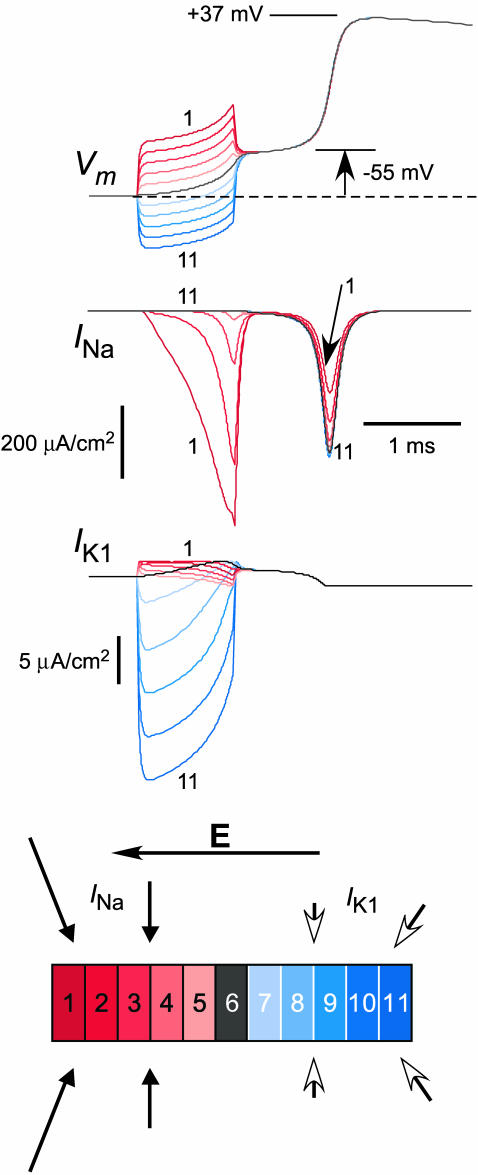
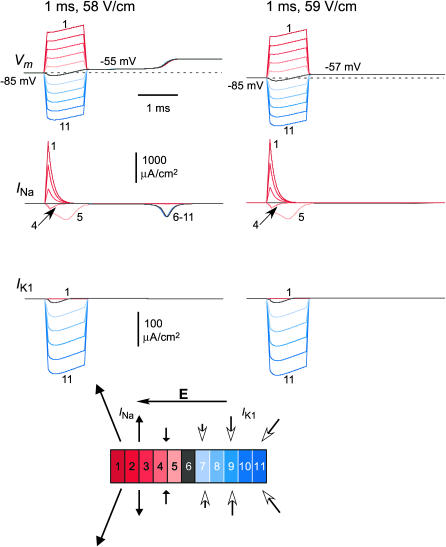
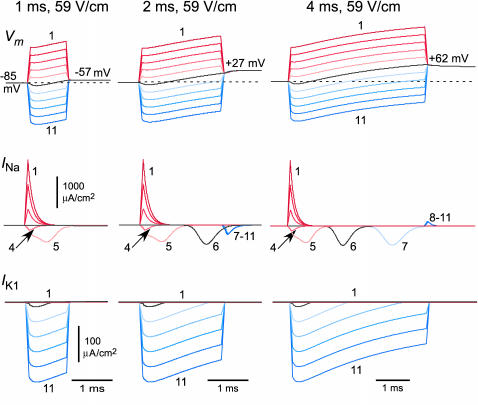
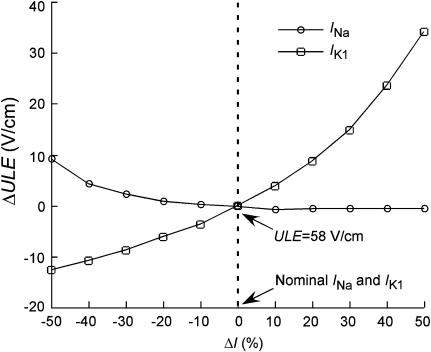
Transmembrane potential responses of single cardiac cells stimulated at rest were studied with uniform rectangular field pulses having durations of 0.5-10 ms. Cells were enzymatically isolated from guinea pig ventricles, stained with voltage sensitive dye di-8-ANEPPS, and stimulated along their long axes. Fluorescence signals were recorded with spatial resolution of 17 microm for up to 11 sites along the cell. With 5 and 10 ms pulses, all cells (n = 10) fired an action potential over a broad range of field amplitudes (approximately 3-65 V/cm). With 0.5 and 1 ms pulses, all cells (n = 7) fired an action potential for field amplitudes ranging from the threshold value (approximately 4-8 V/cm) to 50-60 V/cm. However, when the field amplitude was further increased, five of seven cells failed to fire an action potential. We postulated that this paradoxical loss of excitation for higher amplitude field pulses is the result of nonuniform polarization of the cell membrane under conditions of electric field stimulation, and a counterbalancing interplay between sodium current and inwardly rectifying potassium current with increasing field strength. This hypothesis was verified using computer simulations of a field-stimulated guinea pig ventricular cell. In conclusion, we show that for stimulation with short-duration pulses, cells can be excited for fields ranging between a low amplitude excitation threshold and a high amplitude threshold above which the excitation is suppressed. These results can have implications for the mechanistic understanding of defibrillation outcome, especially in the setting of diseased myocardium.
Figures
Similar articles
-
Spatial heterogeneity of transmembrane potential responses of single guinea-pig cardiac cells during electric field stimulation.J Physiol. 2002 Jul 15;542(Pt 2):477-92. doi: 10.1113/jphysiol.2001.013197. J Physiol. 2002. PMID: 12122146 Free PMC article.
-
Nonuniform responses of transmembrane potential during electric field stimulation of single cardiac cells.Am J Physiol. 1999 Jul;277(1):H351-62. doi: 10.1152/ajpheart.1999.277.1.H351. Am J Physiol. 1999. PMID: 10409215
-
Decomposition of field-induced transmembrane potential responses of single cardiac cells.IEEE Trans Biomed Eng. 2002 Sep;49(9):1031-7. doi: 10.1109/TBME.2002.802055. IEEE Trans Biomed Eng. 2002. PMID: 12214875
-
Can optical recordings of membrane potential be used to screen for drug-induced action potential prolongation in single cardiac myocytes?J Pharmacol Toxicol Methods. 2006 Sep-Oct;54(2):173-82. doi: 10.1016/j.vascn.2006.02.013. Epub 2006 Mar 6. J Pharmacol Toxicol Methods. 2006. PMID: 16632384
-
Ionic currents involved in shock-induced nonlinear changes in transmembrane potential responses of single cardiac cells.Pflugers Arch. 2004 Dec;449(3):248-56. doi: 10.1007/s00424-004-1335-9. Pflugers Arch. 2004. PMID: 15480751
Cited by
-
Electrical Stimulation for Low-Energy Termination of Cardiac Arrhythmias: a Review.Cardiovasc Drugs Ther. 2023 Apr;37(2):323-340. doi: 10.1007/s10557-021-07236-5. Epub 2021 Aug 7. Cardiovasc Drugs Ther. 2023. PMID: 34363570 Review.
-
Extracellular recordings of field potentials from single cardiomyocytes.Biophys J. 2006 Oct 1;91(7):2543-51. doi: 10.1529/biophysj.106.085183. Epub 2006 Jul 14. Biophys J. 2006. PMID: 16844752 Free PMC article.
-
Damage-free peripheral nerve stimulation by 12-ns pulsed electric field.Sci Rep. 2017 Sep 5;7(1):10453. doi: 10.1038/s41598-017-10282-5. Sci Rep. 2017. PMID: 28874684 Free PMC article.
-
Optical imaging of voltage and calcium in cardiac cells & tissues.Circ Res. 2012 Feb 17;110(4):609-23. doi: 10.1161/CIRCRESAHA.111.247494. Circ Res. 2012. PMID: 22343556 Free PMC article. Review.
-
Low energy defibrillation in human cardiac tissue: a simulation study.Biophys J. 2009 Feb 18;96(4):1364-73. doi: 10.1016/j.bpj.2008.11.031. Biophys J. 2009. PMID: 19217854 Free PMC article.
References
-
- Anderson, J. L., A. P. Hallstrom, A. E. Epstein, S. L. Pinski, Y. Rosenberg, M. O. Nora, D. Chilson, D. S. Cannom, and R. Moore. 1999. Design and results of the antiarrhythmics vs implantable defibrillators (AVID) registry. The AVID investigators. Circulation. 99:1692–1699. - PubMed
-
- Cartee, L. A., and R. Plonsey. 1992. The transient subthreshold response of spherical and cylindrical cell models to extracellular stimulation. IEEE Trans. Biomed. Eng. 39:76–85. - PubMed
-
- Cheng, D. K., L. Tung, and E. A. Sobie. 1999. Nonuniform responses of transmembrane potential during electric field stimulation of single cardiac cells. Am. J. Physiol. 277:H351–H362. - PubMed
MeSH terms
Substances
LinkOut - more resources
Full Text Sources
Other Literature Sources
