. 2005 Apr;88(4):2472-93.
doi: 10.1529/biophysj.104.051938. Epub 2005 Jan 21.

Exploring the helix-coil transition via all-atom equilibrium ensemble simulations

Affiliations

Exploring the helix-coil transition via all-atom equilibrium ensemble simulations

Eric J Sorin et al. Biophys J. 2005 Apr.

Abstract

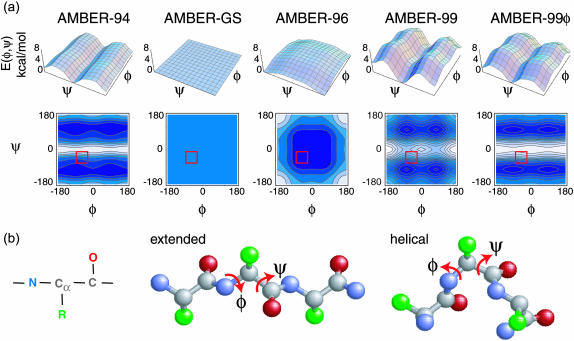
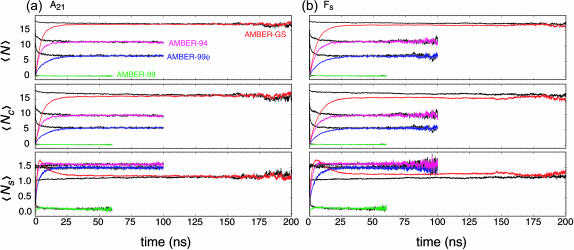
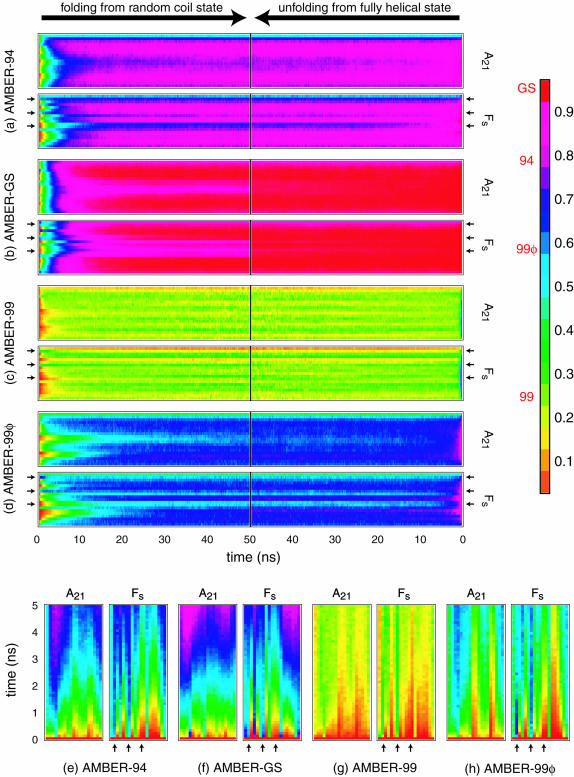
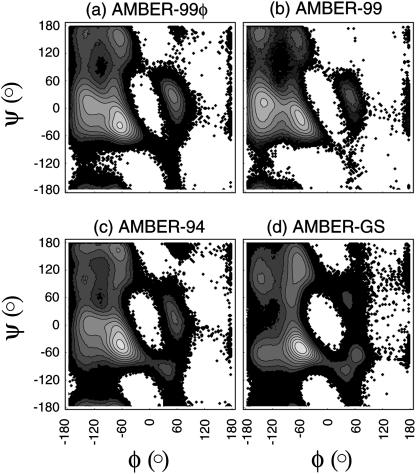
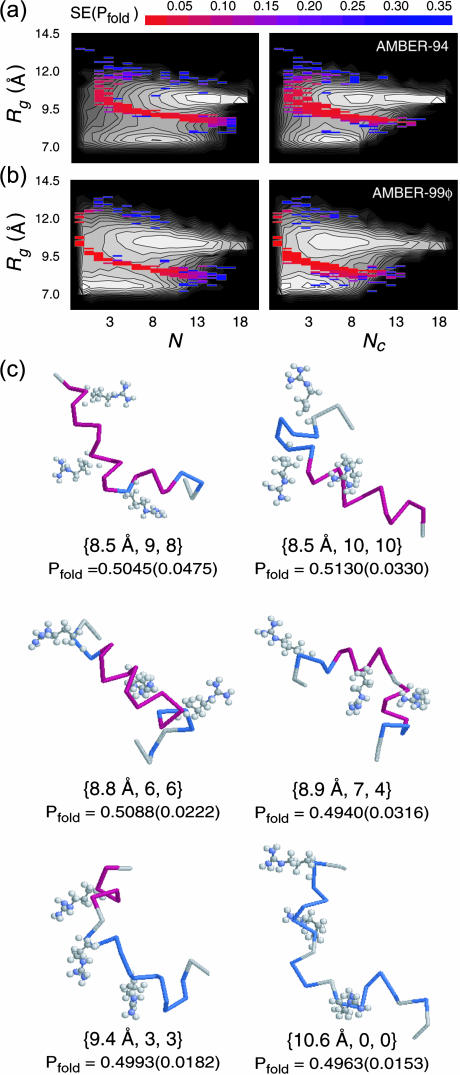
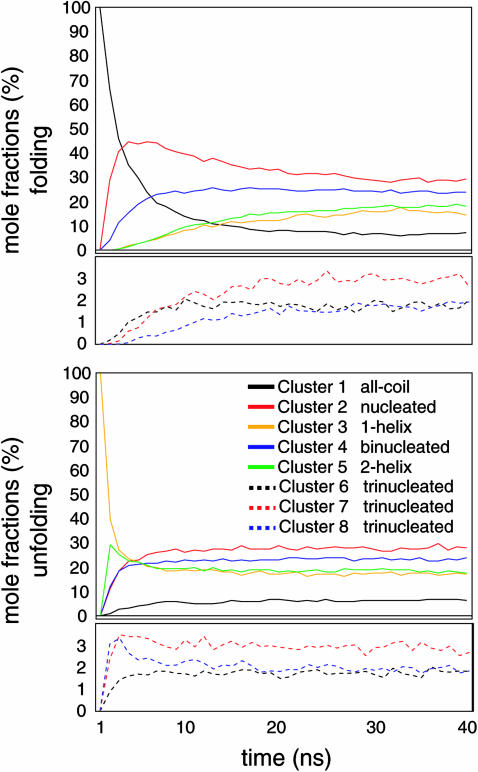
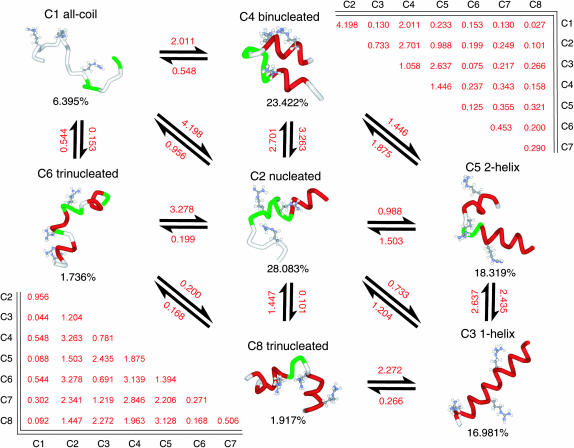
The ensemble folding of two 21-residue alpha-helical peptides has been studied using all-atom simulations under several variants of the AMBER potential in explicit solvent using a global distributed computing network. Our extensive sampling, orders of magnitude greater than the experimental folding time, results in complete convergence to ensemble equilibrium. This allows for a quantitative assessment of these potentials, including a new variant of the AMBER-99 force field, denoted AMBER-99 phi, which shows improved agreement with experimental kinetic and thermodynamic measurements. From bulk analysis of the simulated AMBER-99 phi equilibrium, we find that the folding landscape is pseudo-two-state, with complexity arising from the broad, shallow character of the "native" and "unfolded" regions of the phase space. Each of these macrostates allows for configurational diffusion among a diverse ensemble of conformational microstates with greatly varying helical content and molecular size. Indeed, the observed structural dynamics are better represented as a conformational diffusion than as a simple exponential process, and equilibrium transition rates spanning several orders of magnitude are reported. After multiple nucleation steps, on average, helix formation proceeds via a kinetic "alignment" phase in which two or more short, low-entropy helical segments form a more ideal, single-helix structure.


Figures

FIGURE 1
FIGURE 1
Backbone torsion potentials of the force fields studied. (a) The (φ,ψ) potentials for the AMBER all-atom force fields assessed in this study are shown in three-dimensional form and scaled to represent relative energy differences between them. Contours are drawn at nkT levels for 0 ≤ nnmax, and red boxes indicate the region of the phase space considered helical for Lifson-Roig calculations based on assessing the dependence of LR parameters on the (φ,ψ) cutoff as described in the text. The AMBER-GS potential is zero for the entire space and the helical regime lies on the maximum energy plateau of the AMBER-96 potential. AMBER-99 includes rotational barriers greater than kT along φ that are not present in the heliophilic AMBER-94. These barriers are removed in our AMBER-99φ variant. (b) The peptide unit: heavy-atom ball-and-stick representations of the peptide backbone showing the rotatable backbone φ and ψ torsions for the fully extended peptide and the ideal helix conformation.
FIGURE 2
FIGURE 2
Convergence of ensemble-averaged helical metrics. Time evolution of the (a) A21 and (b) Fs folding ensembles under the AMBER-94 (magenta), AMBER-GS (red), AMBER-99 (green), and AMBER-99φ (blue) potentials. The plots include, from top to bottom, the mean α-helix content, mean contiguous helical length, and mean number of helical segments per conformation according to classical LR counting theory. Native ensembles that converge with corresponding color-coded folding ensembles are shown in black. Signal noise in the longer time regime is due to fewer simulations reaching that timescale (additional data at long times have been removed for visual clarity). The relative helical character remains essentially unchanged with Arg insertions in each force field. Although the AMBER-GS Fs ensemble did not reach absolute equilibrium on the timescales simulated, that force field clearly predicts greater helical content than the other AMBER potentials.
FIGURE 3
FIGURE 3
Ensemble convergence at the residue level. Probabilities of each residue having helical (φ,ψ) as a function time for the folding (left) and native (right) ensembles are shown. Small black arrows indicate the positions of ARG substitutions in Fs. In each plot the sequence runs from the N-terminal (bottom) to the C-terminal (top). Note that these probabilities do not represent the probabilities of taking part in a helical segment, as defined in LR theory as three or more contiguous helical residues. Red labels to the left of the key indicate the regime of helicity represented by each force field. Lower panels (eh) magnify the first 5 ns of folding in each force field for inspection of nucleation trends, with the sequence running from C-terminal (left) to N-terminal (right).
FIGURE 4
FIGURE 4
Sampling the (φ,ψ) free energy landscape. The equilibrium sampling of backbone torsional space using the (a) AMBER-99φ, (b) AMBER-99, (c) AMBER-94, and (d) AMBER-GS potentials for all residues in the Fs peptide are shown. Each map consists of ∼40,000 equilibrium conformations with backbone torsional values binned in 3° intervals and contours representing kT units at 305 K. Minima in each landscape are described in the text.
FIGURE 5
FIGURE 5
Polyproline structural content. PP-type conformational probabilities per residue are shown for both A21 (gray) and Fs (black) using the equilibrium sampling (solid lines) and the unfolded state (dashed lines). As described in the text, the AMBER-99 ensembles remain essentially unchanged due to the favoring of extended conformations in that force field. Two parts are shown in panel d to distinguish the PPII content of the unfolded state (top) from that observed in the equilibrium sampling (bottom). Due to the small proportion of highly unfolded configurations in the AMBER-GS ensembles, too few unfolded conformations to quantitatively access PPII presence were analyzed. However, it is clear from the top plot in panel d that unfolded conformations in that force field favor PPII structure to a significant degree.
FIGURE 6
FIGURE 6
Simulated LR parameters and detection of intermediates. (a) The values shown are from simulations under the AMBER-94 (□), AMBER-GS (▵), AMBER-99φ (▪), and AMBER-99 (▴) potentials. The top frames demonstrate the dependence of the LR parameters on the (φ,ψ) cutoff in determination of residue helicity at 305 K, with minimum variance points lying in the 25–30° regime. The bottom frames show the calculated LR parameters at 273, 305, and 337 K using a 30° cutoff. Although the LR parameters derived from the AMBER-99 potential exhibit a negligible temperature dependence, changing only the φ torsional potential between the AMBER-99 and AMBER-99φ potentials results in a more realistic temperature dependence of w(T). The experimentally determined temperature dependence of w (Rohl and Baldwin, 1997) is approximated by the dashed line. (b) Comparison of single exponential fits of N and Nc values for both peptides in the three folding potentials employed. In each case, the lack of simultaneous rates for these two metrics signifies the existence of one or more kinetic intermediates. The fits for small values of N and Nc are somewhat ambiguous (based on the fitting method), and should therefore not be taken as quantitative measures; refer to Table 3 and the relevant portion of the text for nucleation kinetics.
FIGURE 7
FIGURE 7
Equilibrium residue properties. From top to bottom are the mean α-helicity, 310 helicity, helix dwell time, and coil dwell time per residue for the A21 (left) and Fs (right) sequences under the AMBER-99φ potential at 305 K. The difference is shown for each ensemble property on the right, with dashed vertical lines representing locations of ARG insertions. The 310-helicity is based on Dictionary of Secondary Structure in Proteins assignments, whereas all other frames are based on LR counting theory. The native and folding ensembles are shown in black and gray, respectively, and highlight the degree of convergence between the ensembles on the residue level.
FIGURE 8
FIGURE 8
Folding landscape characterization. Free energy surfaces for (a) A21 and (b) Fs under the four AMBER potentials as projected onto the Rg, N, Nc, and Ns folding metrics. Each landscape was generated using ∼40,000 peptide conformations randomly chosen from the equilibrium simulation ensembles. Contours represent 0.25 kcal/mol intervals with each conformation assigned a statistical free energy−RT Log P, where P is the probability of the conformation within the ensemble sampled. The radius of gyration was binned in 0.5 Å intervals for all plots.
FIGURE 9
FIGURE 9
Pfold detection of the putative transition state ensemble. The (a) AMBER-94 and (b) AMBER-99φ ensembles were used to generate Pfold values on the conformational grid defined by Rg, N, and Nc, with the radius of gyration binned in 0.1 Å intervals and cutoffs in the two-state approximation taken from the free energy landscapes in Fig. 8, which are shown here in grayscale. The TSE region was defined by bins with 0.45 < Pfold < 0.55, and the mean ± SE in Pfold outlines the confidence level of putative TSE regions. (c) As described in the text, the TSE consists of a diverse set of conformations with varying molecular size and helical content, ranging from relatively extended to collapsed structures with one or more nucleation sites or helical segments present. Representations for several putative TSE conformations with low SE are shown, with violet and cyan representing residues in helical and turn conformations, respectively. The bin {Rg, N, Nc} and Pfold(mean ± SE) are shown below each TSE member. These examples, which represent a small portion of the very heterogeneous TSE, only highlight the conformational diversity within the TSE region.
FIGURE 10
FIGURE 10
Equilibrium end-to-end distance distributions for A21 (top) and Fs (bottom) under the AMBER-99φ force field at 305 K as measured from the N-acetyl carbon to the C-terminal nitrogen. The difference is shown in the bottom panel, with A21 favoring more collapsed conformations by ∼10% over Fs and Fs favoring more extended conformations. For reference, the ideal helix has an end-to-end distance of ∼31 Å using this measurement.
FIGURE 11
FIGURE 11
Microstate helix-coil kinetics. The time evolution of mole fractions calculated over each 1 ns window before reaching equilibrium are shown for the eight dominant clusters listed in Table 4 for the folding (top) and unfolding (bottom) Fs ensembles in AMBER-99φ. From the initially increasing species in each plot, the apparent bulk unfolding mechanism is not equivalent to the reverse of the folding mechanism: folding initiates via nucleation and propagation of small single-helix structures (red) followed by evolution to the diverse equilibrium populations described in the text; in contrast, unfolding begins predominantly with the breaking of single-helix segments into multiple shorter helices (green), and may be considered as nucleation and propagation of the coil state within helical regions.
FIGURE 12
FIGURE 12
Network for helix conformational diffusion. Fs structures representing seven of the eight predominant microstates are shown on a simplified network of configurational dynamics. Notation above and below each structure specify the cluster and the equilibrium mole fraction (%) in the AMBER-99φ potential. Equilibrium rates between microstates derived from the transition probability matrix are shown in red (ns−1) and are based on 100-ps temporal resolution. The residue coloration scheme includes random coil (white), turn (green), and helix (red).

Similar articles

Cited by

References

    1. Armen, R., D. O. V. Alonso, and V. Daggett. 2003. The role of α-, 310-, and π-helix in helix-coil transitions. Protein Sci. 12:1145–1157. - PMC - PubMed
    1. Banavar, J. R., A. Maritan, C. Micheletti, and A. Trovato. 2002. Geometry and physics of proteins. Proteins. 47:315–322. - PubMed
    1. Berendsen, H., J. Postma, W. Vangunsteren, A. Dinola, and J. Haak. 1984. Molecular-dynamics with coupling to an external bath. J. Chem. Phys. 81:3684–3690.
    1. Bolhuis, P. G., C. Dellago, and D. Chandler. 2000. Reaction coordinates of biomolecular isomerization. Proc. Natl. Acad. Sci. USA. 97:5877–5882. - PMC - PubMed
    1. Brooks, B. R., R. E. Bruccoleri, B. D. Olafson, D. J. States, S. Swaminathan, and M. Karplus. 1983. CHARMM: a program for macromolecular energy, minimisation, and dynamics calculations. J. Comput. Chem. 4:187–217.

Publication types