. 2005 Apr 1;280(13):12658-67.
doi: 10.1074/jbc.M413140200. Epub 2005 Jan 23.

Monastrol inhibition of the mitotic kinesin Eg5

Affiliations

Monastrol inhibition of the mitotic kinesin Eg5

Jared C Cochran et al. J Biol Chem. .

Abstract

Monastrol is a small, cell-permeable molecule that arrests cells in mitosis by specifically inhibiting Eg5, a member of the Kinesin-5 family. We have used steady-state and presteady-state kinetics as well as equilibrium binding approaches to define the mechanistic basis of S-monastrol inhibition of monomeric human Eg5/KSP. In the absence of microtubules (Mts), the basal ATPase activity is inhibited through slowed product release. In the presence of microtubules, the ATPase activity is also reduced with weakened binding of Eg5 to microtubules during steady-state ATP turnover. Monastrol-treated Eg5 also shows a decreased relative affinity for microtubules under equilibrium conditions. The Mt.Eg5 presteady-state kinetics of ATP binding and the subsequent ATP-dependent isomerization are unaffected during the first ATP turnover. However, monastrol appears to stabilize a conformation that allows for reversals at the ATP hydrolysis step. Monastrol promotes a dramatic decrease in the observed rate of Eg5 association with microtubules, and ADP release is slowed without trapping the Mt.Eg5.ADP intermediate. We propose that S-monastrol binding to Eg5 induces a stable conformational change in the motor domain that favors ATP re-synthesis after ATP hydrolysis. The aberrant interactions with the microtubule and the reversals at the ATP hydrolysis step alter the ability of Eg5 to generate force, thereby yielding a nonproductive Mt.Eg5 complex that cannot establish or maintain the bipolar spindle.


Figures

Scheme 1
Scheme 1
Fig 1
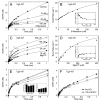
Fig 1. Monastrol inhibition of Eg5 steady-state ATPase
A, in the absence of Mts, Eg5·ADP was treated with varying concentrations of S-monastrol for 30 min and was reacted with MgATP. Final concentrations: 1 μm Eg5, 0–150 μm S-monastrol, and 100 μm [α-32P]MgATP. The rate of product formation was plotted as a function of S-monastrol concentration, and each data set was fit to Equation 1. For Eg5–367 (•), Kd,S = 2.3 ± 0.4 μm. Inset, Eg5–437 (▴), Kd,S = 2.5 ± 0.5 μm. B, Eg5·ADP was treated with varying concentrations of S-monastrol for 30 min, and then the Mt·Eg5S complex was formed and reacted with MgATP. Final concentrations: 1 μm Eg5, 30 μm tubulin, 20 μm Taxol, 0–150 μm S-monastrol, and 1 mm [α-32P]MgATP. For Eg5–367 (•), Kd,S = 13.8 ± 1.0 μm and for Eg5–437 (▴), Kd,S = 4.0 ± 0.4 μm. C, Eg5–367 was treated with S-monastrol for 30 min and then the Mt·Eg5S complex was formed with increasing microtubule concentrations and reacted with MgATP. Final concentrations: 1 μm Eg5, 0–40 μm tubulin, 20 μm Taxol, 150 μm S-monastrol, and 500 μm [α-32P]MgATP. Data were fit to Equation 2, and the steady-state parameters were kcat = 1.22 ± 0.03 s−1 and K½,Mt = 6.7 ± 0.4 μm. D, Eg5–437 under similar conditions as Panel C: kcat = 0.56 ± 0.03 s−1 and K½,Mt = 33.3 ± 3.3 μm. E, Eg5–367 (with or without S-monastrol) was incubated for 30 min, and then the Mt·Eg5S complex was formed and reacted with increasing MgATP concentrations. Final concentrations: 0.1 μm Eg5, 20 μm tubulin, 20 μm Taxol, ±150 μm S-monastrol, and 0.5–200 μm [α-32P]MgATP. Data were fit to the Michaelis-Menten equation, and the steady-state parameters were determined (control: kcat = 6.10 ± 0.07 s−1 and Km,ATP = 9.5 ± 0.4 μm; S-monastrol: kcat = 1.54 ± 0.03 s−1 and Km,ATP = 3.6 ± 0.3 μm). F, Eg5–437 under similar conditions as Panel C. Control: kcat = 2.77 ± 0.08 s−1 and Km,ATP = 20.7 ± 3.2 μm; S-monastrol: kcat = 0.43 ± 0.01 s−1 and Km,ATP = 4.1 ± 0.7 μm).
Fig 2
Fig 2. Mt·Eg5S cosedimentation experiments
A, in the absence of additional nucleotide, Eg5 was treated with or without S-monastrol for 15 min, followed by incubation with increasing concentrations of microtubules for 30 min. Final concentrations: 2 μm Eg5–437, 0–6 μm tubulin for control, 0–20 μm tubulin for S-monastrol, 20 μm Taxol, and 150 μm S-monastrol. The fraction of Eg5 in the microtubule pellet was plotted as a function of the total microtubule concentration, and the data were fit to Equation 3. In the absence of S-monastrol (▴), the Kd,Mt = 0.07 ± 0.03 μm, and in the presence of S-monastrol (▵), Kd,Mt = 2.3 ± 0.2 μm. B, Eg5 was treated with increasing S-monastrol concentrations for 15 min, followed by incubation with Mts for 30 min. Final concentrations: 2 μm Eg5, 4 μm tubulin, 20 μm Taxol, and 0–150 μm S-monastrol. The fraction of Eg5 in the microtubule pellet was plotted as a function of S-monastrol concentration. C, an image of a Coomassie Blue-stained SDS gel from Mt·Eg5S cosedimentation experiments at different nucleotide conditions. Eg5 was treated with or without S-monastrol for 15 min, followed by incubation with Mts for 30 min. Each nucleotide was rapidly mixed with the solution at the end of the incubation, and the reaction mixture was immediately subjected to centrifugation. Final concentrations: 2 μm Eg5–367, 4 μm tubulin, 20 μm Taxol, 150 μm S-monastrol, and 2 mm AXP. The supernatant (S) and pellet (P) for each reaction were loaded consecutively with an indication of the additional nucleotide above each supernatant/pellet pair.
Fig 3
Fig 3. MantATP binding to the Mt·Eg5S complex
A, Eg5 was treated with increasing concentrations of S-monastrol, followed by incubation with Mts for 30 min. Final concentrations: 3 μm Eg5, 10 μm tubulin, 20 μm Taxol, 0–150 μm S-monastrol, and 10 μm mantATP. The preformed Mt·Eg5S complex was rapidly mixed in the stopped-flow instrument with mantATP and two representative transients for Eg5–367 (±150 μm S-monastrol) are shown. Insets, the observed rate and amplitude of the exponential increase in fluorescence were plotted as a function of S-monastrol concentration. B, Eg5–367 was incubated in the presence or absence of S-monastrol, and the preformed Mt·Eg5 complexes were reacted with increasing mantATP concentrations. Final concentrations: 0.5 μm Eg5 for 0.5–3 μm mantATP and 3 μm Eg5 for 3–60 μm mantATP, 10 μm tubulin, 20 μm Taxol, and 150 μm S-monastrol. The observed rate of the fast exponential increase in fluorescence was plotted as a function of mantATP concentration, and the data were fit to a hyperbola. In the absence of S-monastrol (•), kmax = 47.0 ± 2.3 s−1, K½,mATP = 7.9 ± 1.6 μm, koff = 18.0 ± 0.7 s−1. In the presence of S-monastrol (○), kmax = 47.8 ± 1.9 s−1, K½,mATP = 9.4 ± 1.9 μm, koff = 19.1 ± 0.7 s−1. Inset, the observed rate of mantATP binding at the lowest mantATP concentrations. The data were fit to Equation 8 to yield the second-order rate constant for mantATP binding in the absence (2.2 ± 0.3 μm−1s−1) and in the presence of S-monastrol (2.1 ± 0.3 μm−1s−1).
Fig 4
Fig 4. ATP hydrolysis kinetics for the Mt·Eg5S complex
A, time course of [α-32P]ADP·Pi formation after rapidly mixing a preformed Mt·Eg5S complex with MgATP plus additional KCl to lower steady-state turnover (see “Materials and Methods”). Final concentrations: 5 μm Eg5–437, 6 μm tubulin, 20 μm Taxol, 0–200 μm S-monastrol, 300 μm MgATP, and 100 mm KCl. B, the observed exponential rate of the burst phase was plotted as a function of S-monastrol concentration. The fit of the data to a hyperbola provided the observed rate constant for ATP hydrolysis at 49.9 ± 3.4 s−1. Inset, the amplitude of the burst phase decreased as a function of S-monastrol concentration. The data were fit to Equation 1, yielding an apparent Kd,S = 29 ± 9 μm. C, time course of radiolabeled product formation by Mt·Eg5S complex at increasing MgATP concentrations. Final concentrations: 5 μm Eg5–437, 6 μm tubulin, 20 μm Taxol, 100 μm S-monastrol, 10–400 μm MgATP, and 100 mm KCl. D, the exponential burst rate was plotted as a function of MgATP concentration. The fit of the data to a hyperbola defined the maximum burst rate of ATP hydrolysis for Eg5–437 in the presence of S-monastrol, kmax = 36.3 ± 3.2 s−1 and the Kd,ATP = 154 ± 28 μm. Inset, the amplitude of the burst phase was plotted as a function of MgATP concentration. The data were fit to a hyperbola yielding a maximum burst amplitude at 1.3 ± 0.1 μm, and the Kd,ATP = 15 ± 3 μm. E, time course of ADP·Pi formation by the Mt·Eg5–437S complex at increasing microtubule concentrations. Final concentrations: 5 μm Eg5–437, 6–40 μm tubulin, 20 μm Taxol, 100 μm S-monastrol, 300 μm MgATP, and 100 mm KCl. Insets, the burst rate and burst amplitude of each transient are shown, respectively. Error bars represent the standard error in the fit of the data. F, time course of ADP·Pi formation by the Mt·Eg5S-437 complex ± 100 mm KCl with the MgATP. Final concentrations: 5 μm Eg5–437, 20 μm tubulin, 20 μm Taxol, 100 μm S-monastrol, 100 μm MgATP, ± 100 mm KCl. Each data set was fit to Equation 4. No KCl (•):kb = 12.7 ± 1.6 s−1, Ao = 0.95 ± 0.06 μm, and kss = 2.5 ± 0.1 μm ADP·s−1. Reaction with 100 mm KCl (□): kb = 12.4 ± 1.7 s−1, Ao = 1.01 ± 0.07 μm, and kss = 1.8 ± 0.1 μm ADP·s−1.
Fig 5
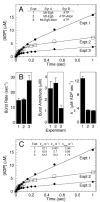
Fig 5. Acid-quench experiments to evaluate sequential addition of S-monastrol
A, the time course of product formation under three different experimental conditions. Experiment 1 (Expt. 1): Mt·Eg5 complex was reacted with MgATP (▪). Expt. 2: Mt·Eg5 complex was reacted with MgATP plus S-monastrol (□). Expt. 3: Mt·Eg5 complex plus S-monastrol was reacted with MgATP (♦). Final concentrations: 5 μm Eg5–437, 6 μm tubulin, 20 μm Taxol, 100 μm S-monastrol, 200 μm MgATP, and 100 mm KCl. The data for each experiment were fit to Equation 4. B, the exponential burst rate, burst amplitude, and the rate constant of the linear phase defining steady-state turnover were plotted for each experimental setup. Error bars represent the standard error in the fit of the data. C, the data from panels A and B were modeled to Equations 4–7 to define the ATP hydrolysis constants k+2, k−2, and kslow (Scheme 1 and Table I).
Fig 6
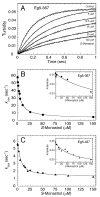
Fig 6. Eg5S association with microtubules
Eg5 was treated with increasing S-monastrol concentrations then rapidly mixed in the stopped-flow instrument with Taxol-stabilized microtubules. Final concentrations: 5 μm Eg5, 6 μm tubulin, 20 μm Taxol, and 0–150 μm S-monastrol. A, representative stopped-flow transients are shown at various S-monastrol concentrations (as indicated). Each transient was fit to a single exponential function. B, for Eg5–367 (•), the rate constant obtained from the rapid exponential phase of each transient in A was plotted as a function of S-monastrol concentration. The data were fit to Equation 10, yielding Kd,S = 5.1 ± 0.4 μm. C, for Eg5–437 (▴), the observed rate of Mt association versus S-monastrol concentration; Kd,S = 6.2 ± 0.7 μm. Insets for B and C, the amplitude of the exponential phase versus S-monastrol concentration for each Eg5 motor, respectively.
Fig 7
Fig 7. MantADP release from Mt·Eg5S complex
A preformed Eg5·mantADP complex was treated with increasing S-monastrol concentrations, then the Eg5S·mantADP complex was rapidly mixed in the stopped-flow instrument with microtubules and MgATP. Final concentrations: 2 μm Eg5, 4 μm mantADP, 25 μm tubulin, 20 μm Taxol, 0–150 μm S-monastrol, and 1 mm MgATP. A, representative transients are shown for different S-monastrol concentrations (as indicated). B, the rate obtained from the exponential decrease in fluorescence of each transient was plotted as a function of S-monastrol concentration, and the data were fit to Equation 10. For Eg5–367 (•), Kd,S = 14.4 ± 3.4 μm. For Eg5–437 (▴), Kd,S = 15.2 ± 3.2 μm. Insets, the amplitude of the exponential decrease in fluorescence was plotted as a function of S-monastrol concentration. For Eg5–367 (•), Kd,S = 13.5 ± 2.0 μm. For Eg5–437 (▴), Kd,S = 15.2 ± 2.7 μm.
Fig 8
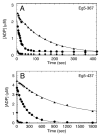
Fig 8. Equilibrium state of Eg5S complexes
Eg5·[α-32P]ADP was incubated in the presence (▴ and ♦) or absence (•) of S-monastrol. The complexes were reacted with a creatine kinase/phosphocreatine ATP regeneration system plus MgATP in the presence (♦) or absence (• and ▴) of Mts. Final concentrations: 5 μm Eg5, 10 μm tubulin, 20 μm Taxol, 100 μm S-monastrol, 0.3 mg/ml creatine kinase, 4 mm phosphocreatine, and 2.5 mm MgATP. The concentration of tightly bound [α-32P]ADP was plotted versus time, and each data set was fit to Equation 11. A, for Eg5–367, in the absence of S-monastrol (no Mts), koff,ADP = 0.05 ± 0.001 s−1 (•). In the presence of S-monastrol (no Mts), koff,ADP = 0.007 ± 0.0002 s−1 (▴). B, for Eg5–437, in the absence of S-monastrol (no Mts), koff,ADP = 0.004 ± 0.0001 s−1 (•). In the presence of 100 μm S-monastrol (no Mts), koff,ADP = 0.001 ± 0.0001 s−1 (▴). For both Eg5 motors, in the presence of S-monastrol and microtubules, a stable Mt·Eg5S·ADP intermediate was not trapped (♦); ADP was rapidly released, but the koff,ADP could not be accurately measured by this coupled assay.
Fig 9
Fig 9. Model for monastrol inhibition of the Mt·Eg5 ATPase
Monastrol appears to stabilize the conformation of the Eg5 motor domain at Species 3, such that ATP hydrolysis in the forward direction and ATP re-synthesis in the reverse direction are both favored. Species 3, 4, and 6 show the neck linker docked onto the motor domain based on the monastrol Eg5 crystal structure that assumes the locked “ATP-like” conformation of the motor domain (23). We have no evidence for the neck linker configuration for the other species; therefore, the neck linker is indicated as a wavy line.

Similar articles

Cited by

References

    1. Inoue S. J Struct Biol. 1997;118:87–93. - PubMed
    1. Compton DA. Annu Rev Biochem. 2000;69:95–114. - PubMed
    1. Mitchison TJ, Salmon ED. Nat Cell Biol. 2001;3:E17–E21. - PubMed
    1. Wittmann T, Hyman A, Desai A. Nat Cell Biol. 2001;3:E28–E34. - PubMed
    1. Karsenti E, Vernos I. Science. 2001;294:543–547. - PubMed

Publication types

MeSH terms

LinkOut - more resources