

High-throughput metabolic state analysis: the missing link in integrated functional genomics of yeasts
- PMID: 15667247
- PMCID: PMC1138975
- DOI: 10.1042/BJ20041162
High-throughput metabolic state analysis: the missing link in integrated functional genomics of yeasts
Abstract
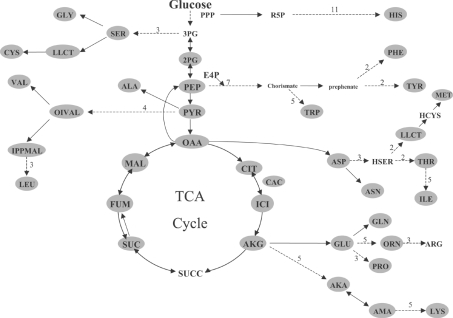
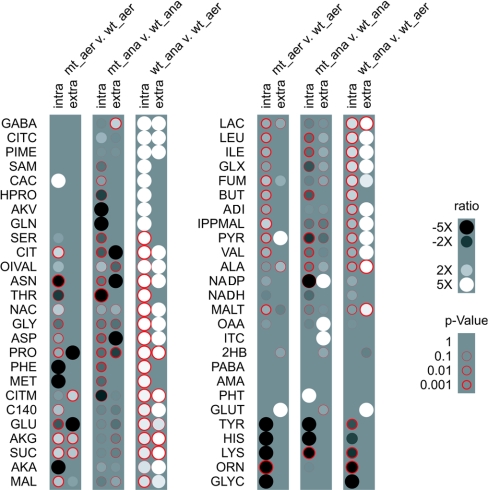
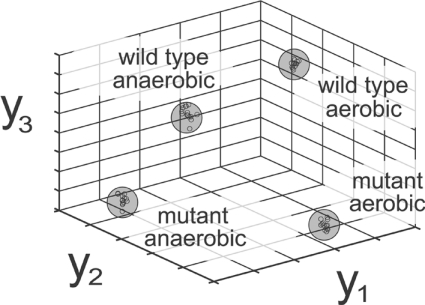
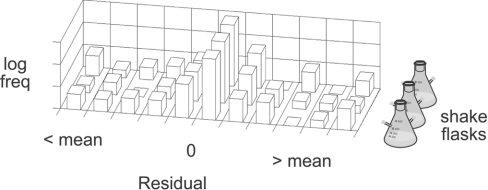
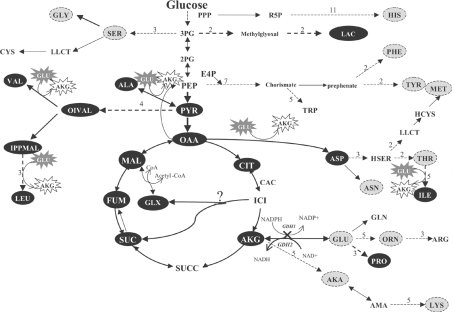
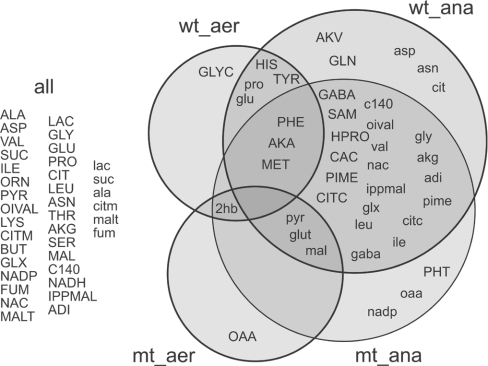
The lack of comparable metabolic state assays severely limits understanding the metabolic changes caused by genetic or environmental perturbations. The present study reports the application of a novel derivatization method for metabolome analysis of yeast, coupled to data-mining software that achieve comparable throughput, effort and cost compared with DNA arrays. Our sample workup method enables simultaneous metabolite measurements throughout central carbon metabolism and amino acid biosynthesis, using a standard GC-MS platform that was optimized for this purpose. As an implementation proof-of-concept, we assayed metabolite levels in two yeast strains and two different environmental conditions in the context of metabolic pathway reconstruction. We demonstrate that these differential metabolite level data distinguish among sample types, such as typical metabolic fingerprinting or footprinting. More importantly, we demonstrate that this differential metabolite level data provides insight into specific metabolic pathways and lays the groundwork for integrated transcription-metabolism studies of yeasts.
Figures
Similar articles
-
High-throughput classification of yeast mutants for functional genomics using metabolic footprinting.Nat Biotechnol. 2003 Jun;21(6):692-6. doi: 10.1038/nbt823. Epub 2003 May 12. Nat Biotechnol. 2003. PMID: 12740584
-
Extracellular metabolomics: a metabolic footprinting approach to assess fiber degradation in complex media.Anal Biochem. 2006 Feb 15;349(2):297-305. doi: 10.1016/j.ab.2005.11.019. Epub 2005 Dec 1. Anal Biochem. 2006. PMID: 16356465
-
Mutations in the Saccharomyces cerevisiae succinate dehydrogenase result in distinct metabolic phenotypes revealed through (1)H NMR-based metabolic footprinting.J Proteome Res. 2010 Dec 3;9(12):6729-39. doi: 10.1021/pr100880y. Epub 2010 Nov 5. J Proteome Res. 2010. PMID: 20964315
-
[Metabolic engineering strategies for carboxylic acids production by Saccharomyces cerevisiae---a review].Wei Sheng Wu Xue Bao. 2011 Dec;51(12):1571-7. Wei Sheng Wu Xue Bao. 2011. PMID: 22379797 Review. Chinese.
-
Metabolite profiling of fungi and yeast: from phenotype to metabolome by MS and informatics.J Exp Bot. 2005 Jan;56(410):273-86. doi: 10.1093/jxb/eri068. Epub 2004 Dec 23. J Exp Bot. 2005. PMID: 15618299 Review.
Cited by
-
Revealing the beneficial effect of protease supplementation to high gravity beer fermentations using "-omics" techniques.Microb Cell Fact. 2011 Apr 23;10:27. doi: 10.1186/1475-2859-10-27. Microb Cell Fact. 2011. PMID: 21513553 Free PMC article.
-
A metabolomic study of the effect of Candida albicans glutamate dehydrogenase deletion on growth and morphogenesis.NPJ Biofilms Microbiomes. 2019 Apr 8;5(1):13. doi: 10.1038/s41522-019-0086-5. eCollection 2019. NPJ Biofilms Microbiomes. 2019. PMID: 30992998 Free PMC article.
-
Connecting extracellular metabolomic measurements to intracellular flux states in yeast.BMC Syst Biol. 2009 Mar 25;3:37. doi: 10.1186/1752-0509-3-37. BMC Syst Biol. 2009. PMID: 19321003 Free PMC article.
-
Application of stable isotope-assisted metabolomics for cell metabolism studies.Metabolites. 2014 Mar 31;4(2):142-65. doi: 10.3390/metabo4020142. Metabolites. 2014. PMID: 24957020 Free PMC article.
-
Integrating transcriptomics and metabolomics for the analysis of the aroma profiles of Saccharomyces cerevisiae strains from diverse origins.BMC Genomics. 2017 Jun 8;18(1):455. doi: 10.1186/s12864-017-3816-1. BMC Genomics. 2017. PMID: 28595605 Free PMC article.
References
-
- Oliver S. G. Yeast as a navigational aid in genome analysis. Microbiology. 1997;7:405–409. - PubMed
-
- Oliver S. G., Winson M. K., Kell D. B., Baganz F. Systematic functional analysis of the yeast genome. Trends Biotechnol. 1998;16:373–378. - PubMed
-
- Lee T. I., Rinaldi N. J., Robert F., Odom D. T., Bar-Joseph Z., Gerber G. K., Hannett N. M., Harbison C. T., Thompson C. M., Simon I., et al. Transcriptional regulatory networks in Saccharomyces cerevisiae. Science (Washington, D.C.) 2002;298:799–804. - PubMed
-
- Bar-Joseph Z., Gerber G. K., Lee T. I., Rinaldi N. J., Yoo J. Y., Robert F., Gordon D. B., Fraenkel E., Jaakkola T. S., Young R. A., Gifford D. K. Computational discovery of gene modules and regulatory networks. Nat. Biotechnol. 2003;11:1337–1342. - PubMed
-
- Weckwerth W., Wenzel K., Fiehn O. Process for the integrated extraction, identification and quantification of metabolites, proteins and RNA to reveal their co-regulation in biochemical networks. Proteomics. 2004;4:78–83. - PubMed
Publication types
MeSH terms
Substances
LinkOut - more resources
Full Text Sources
Other Literature Sources
Molecular Biology Databases
Research Materials
Miscellaneous