. 2005 Jan 31;168(3):489-99.
doi: 10.1083/jcb.200403078. Epub 2005 Jan 24.

Catalytically inactive human cathepsin D triggers fibroblast invasive growth

Affiliations

Catalytically inactive human cathepsin D triggers fibroblast invasive growth

Valérie Laurent-Matha et al. J Cell Biol. .

Abstract

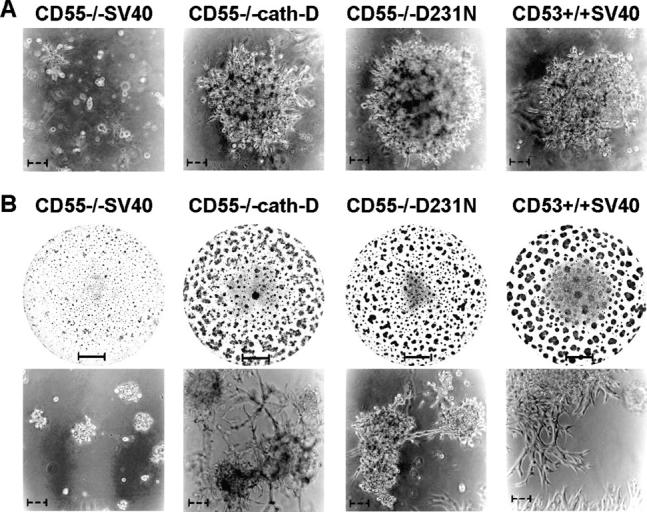
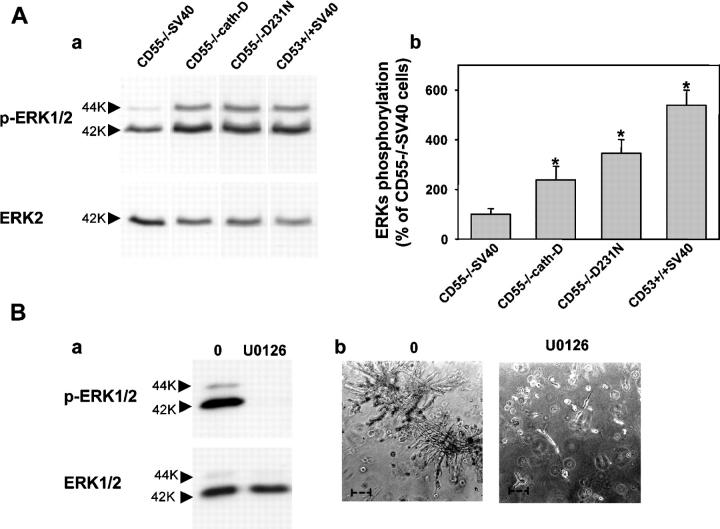
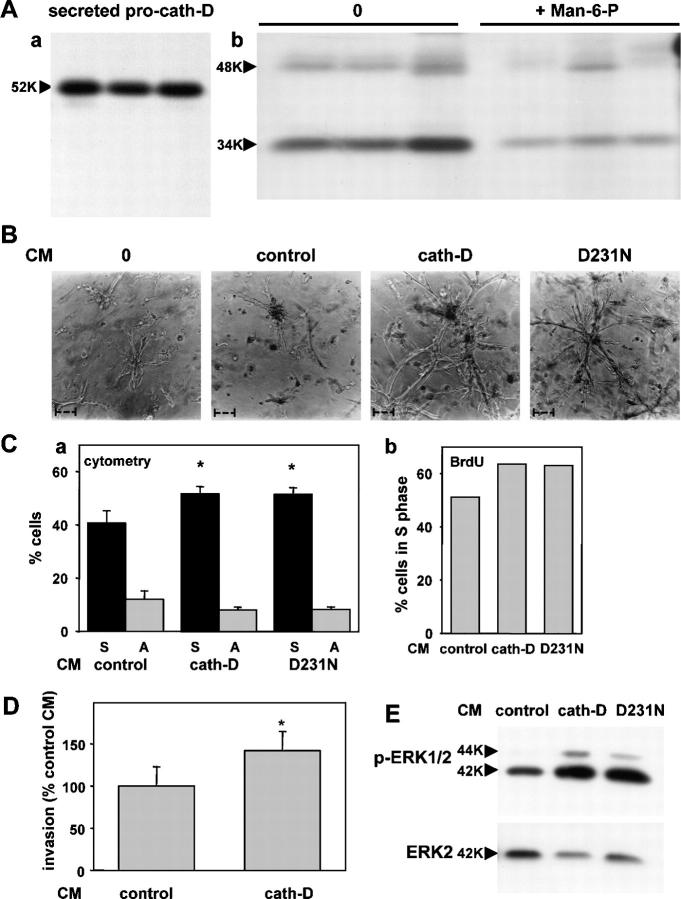
The aspartyl-protease cathepsin D (cath-D) is overexpressed and hypersecreted by epithelial breast cancer cells and stimulates their proliferation. As tumor epithelial-fibroblast cell interactions are important events in cancer progression, we investigated whether cath-D overexpression affects also fibroblast behavior. We demonstrate a requirement of cath-D for fibroblast invasive growth using a three-dimensional (3D) coculture assay with cancer cells secreting or not pro-cath-D. Ectopic expression of cath-D in cath-D-deficient fibroblasts stimulates 3D outgrowth that is associated with a significant increase in fibroblast proliferation, survival, motility, and invasive capacity, accompanied by activation of the ras-MAPK pathway. Interestingly, all these stimulatory effects on fibroblasts are independent of cath-D proteolytic activity. Finally, we show that pro-cath-D secreted by cancer cells is captured by fibroblasts and partially mimics effects of transfected cath-D. We conclude that cath-D is crucial for fibroblast invasive outgrowth and could act as a key paracrine communicator between cancer and stromal cells, independently of its catalytic activity.


Figures

Figure 1.
Figure 1.
3D coculture of fibroblasts and cancer cells. (A) Outgrowth of CD55−/−SV40 fibroblasts (a), HMF fibroblasts (b), and CCD45K skin fibroblasts (c) cocultured with MCF-7 breast cancer cells. Fibroblasts were embedded in Matrigel alone (left) or in the presence of MCF-7 cells embedded in a bottom layer of Matrigel (right). Phase-contrast optical photomicrographs after 3 d of coculture for CD55−/−SV40 fibroblasts and after 6 d of coculture for HMF and CCD45K fibroblasts are shown. One representative experiment out of three is shown. (B) Outgrowth of CD55−/−SV40 fibroblasts cocultured with 3Y1/Ad12 cancer cells. CD55−/−SV40 fibroblasts were embedded in the presence of a bottom layer of 3Y1-Ad12 cancer cell lines secreting no cath-D (control), or human wild-type (cath-D), or D231N cath-D (D231N). Phase-contrast optical photomicrographs after 3 d of coculture are shown (a). Pro-cath-D secretion was analyzed after 3 d of coculture by Western blot (b). One representative experiment out of three is shown. (C) Outgrowth of CD55−/−SV40 fibroblasts cocultured with MCF-7 cells whose pro-cath-D secretion was inhibited by siRNA silencing. CD55−/−SV40 fibroblasts were embedded in the presence of a bottom layer of MCF-7 cells transfected with cath-D or luc siRNAs. Phase-contrast optical photomicrographs after 4 d of coculture are presented (a). One representative experiment out of two is given. Expression and secretion of pro-cath-D were monitored in MCF-7 cell lysates (C) and media (S) before the beginning of the coculture and in the media at days 1–4 of coculture by Western blot (b). (*)Non-specific contaminant protein. Arrows indicate fibroblasts. Bars: (—) 50 μm; (−−) 500 μm. K, molecular mass in kilodaltons.
Figure 2.
Figure 2.
Outgrowth of CD55−/− and CD53+/+ transfected fibroblasts. (A) Matrigel outgrowth. Cells were embedded in Matrigel gels. Phase-contrast optical photomicrographs after 8 d of culture are shown. One representative experiment out of three is shown. Bars, 50 μm. (B) Growth on Matrigel gels. Cells were plated on Matrigel gels. (Top) p-nitrotetrazolium violet cell staining after 7 d of culture in a 24-well plate. (Bottom) Phase-contrast optical photomicrographs after 4 d of culture. One representative experiment out of three is shown. Bars: (—) 2 mm; (−−) 50 μm.
Figure 3.
Figure 3.
Migration of CD55−/− transfected fibroblasts induced by wound healing. Sub-confluent cell layers were wounded by tip-scraping and wound healing was monitored under a phase-contrast microscope. The same area of each dish was monitored microscopically at 0 and 24 h. Experiments were done in triplicate. Bar, 500 μm.
Figure 4.
Figure 4.
Proliferation, apoptosis, migration, and invasion of CD55−/− and CD53+/+ transfected fibroblasts. (A) Proliferation assay. Cells were cultured in DME medium supplemented with 2% FCS and DNA was quantified at the indicated days. Cell growth was expressed as μg of DNA (mean ± SEM of seven independent experiments performed in triplicate). (*)P < 0.001 versus CD55−/−SV40 cells (day 8; t test). (B) Cell cycle and S phase analysis. Cells were cultured in DME medium supplemented with 2% FCS for 3 d and cell cycle was monitored by flow cytometry (a). (*)P < 0.005 versus CD55−/−SV40 cells. S, S phase; A, apoptotic or sub-G0/G1 peak. Experiments were done in triplicate. BrdUrd-incorporated S phase cells were detected with an FITC anti-BrdUrd antibody and counted (b). (C) Apoptosis evaluation. Cells grown for 3 d on Matrigel gels were analyzed by flow cytometry. Cell cycle phases are indicated. A, apoptotic peak. Experiments were done in duplicate. (D) In situ apoptosis. Cells were embedded in Matrigel and after 24 h were incubated with 10 μM of cell permeable Hoechst 33342 (Molecular Probes) and live cells were observed with a microscope equipped with a water immersion objective. Arrows indicate apoptotic bodies. Bars, 10 μm. (E) Electron microscopic appearance of CD55−/−SV40 and CD55−/− cath-D fibroblasts. Cells were embedded in Matrigel (M) and after 24 h were processed for transmission electron microscopy. (a) Ultra thin section in the cytoplasm of an apoptotic CD55−/−SV40 fibroblast. Bar, 0.9 μm. (b) Primary apoptosis as evidenced by complete chromatin condensation followed by secondary necrosis of CD55−/−SV40 fibroblast. Bar, 2.5 μm. (c) Typical morphology of the nuclei of CD55−/−cath-D fibroblast. Bar, 1.4 μm. n, nucleus; nu, nucleolus; v, vacuole. (F) Migration assay. Cells were tested for their ability to migrate through filters coated with collagen I. Data represent the percentage of cells that cross through filters relative to total seeded cells and are the mean ± SD of three independent experiments performed in triplicate. (*)P < 0.05 versus CD55−/−SV40 cells (t test). (G) Invasion assay. Cells were tested for their ability to migrate through filters coated with Matrigel. Data given as in F are the mean ± SD of three independent experiments performed in triplicate. (**)P < 0.005 versus CD55−/−SV40 cells (t test).
Figure 5.
Figure 5.
Activation of ERKs in CD55−/− and CD53+/+ transfected fibroblasts. (A) Activation of the MAPK pathway. Cells were cultured in DME medium supplemented with 2% FCS and cell lysates were analyzed by immunoblotting with an antibody specific for phospho-ERK1/2. Equivalent amounts of ERK2 were confirmed by reprobing the blots with anti-ERK2 antibody. A representative Western blot from four independent experiments is shown in panel a, and the quantitation is shown in panel b. Signals were quantified by scanning densitometry, and phosphorylation level was normalized to ERK2. (*)P < 0.005 versus CD55−/−SV40 cells (t test). White lines indicate that intervening lanes have been spliced out. (B) Effect of U0126 on CD55−/− cath-D invasive growth. CD55−/−cath-D cells in DME with 10% FCS were treated or not with 10 μM U0126 for 6 h. Cells were then embedded in Matrigel. Panel a shows ERK1/2 phosphorylation. Panel b illustrates fibroblast invasive growth after 2 d of culture. Similar results were obtained in two independent experiments. Bar, 50 μm.
Figure 6.
Figure 6.
Paracrine action of pro-cath-D on fibroblasts. (A) Endocytosis of pro-cath-D by fibroblasts. Conditioned media containing secreted labeled pro-cath-D was produced by incubating MCF-7 breast cancer cells with [35S]methionine for 24 h. Immunoprecipitated 52-kD precursor pro-cath-D from labeled medium is shown in panel a. CD55−/− fibroblasts were incubated for 18 h with 35S-labeled conditioned medium containing the secreted labeled pro-cath-D in the absence or presence of 10 mM Man-6-P (b). After washing, cell lysates containing endocytosed [35S]methionine-labeled cath-D were analyzed by SDS-PAGE after immunoprecipitation with M1G8 antibody. Immunoprecipitations were performed in triplicate. (B) Effects of pro-cath-D on fibroblast outgrowth. CD55−/−SV40 fibroblasts embedded in Matrigel were treated in the absence (0) or presence of media conditioned (CM) by 3Y1-Ad12 cancer cell lines secreting no human cath-D (control), 30 nM wild-type (cath-D), or 10 nM D231N cath-D (D231N). After 4 d of culture, cell growth was analyzed by phase-contrast microscopy. Experiments were performed in triplicate. Bars, 50 μm. (C) Effects of pro-cath-D on fibroblast proliferation and apoptosis. CD55−/−SV40 cells were cultured for 3 d in the presence of CM containing no human cath-D (control), 24 nM human cath-D, or 8 nM D231N cath-D supplemented with 2% FCS and cell cycle was monitored by flow cytometry (a). S, S phase; A, apoptotic peak. Similar results were obtained in three independent experiments. (*)P < 0.005 versus control CM (t test). BrdUrd-incorporated S phase cells were detected with an FITC anti-BrdUrd antibody and counted (b). (D) Effects of pro-cath-D on fibroblast invasion. Cells were tested for their ability to invade in the presence of CM containing no human cath-D (control) or 30 nM pro-cath-D. Data are the mean ± SD (n = 5 independent experiments). (*)P < 0.025 versus control CM (t test). (E) Effects of pro-cath-D on MAPK pathway. Cells were cultured for 3 d in the presence of CM supplemented with 2% FCS and containing either no human cath-D (control), 30 nM cath-D, or 10 nM D231N cath-D and ERK1/2 activation was analyzed as described in Fig. 5.

Similar articles

Cited by

References

    1. Bar-Sagi, D., and A. Hall. 2000. Ras and Rho GTPases: a family reunion. Cell 103:227–238. - PubMed
    1. Basset, P., J.P. Bellocq, C. Wolf, I. Stoll, P. Hutin, J.M. Limacher, O. Podhajcer, M.P. Chenard, M.C. Rio, and P. Chambon. 1990. A novel metalloproteinase gene specifically expressed in stromal cells of breast carcinomas. Nature. 348:699–704. - PubMed
    1. Berchem, G.J., M. Glondu, M. Gleizes, J.P. Brouillet, F. Vignon, M. Garcia, and E. Liaudet-Coopman. 2002. Cathepsin-D affects multiple steps of tumor progression: Proliferation, angiogenesis and apoptosis. Oncogene. 21:5951–5955. - PubMed
    1. Bidere, N., H.K. Lorenzo, S. Carmona, M. Laforge, F. Harper, C. Dumont, and A. Senik. 2003. Cathepsin D triggers Bax activation, resulting in selective apoptosis-inducing factor (AIF) relocation in T lymphocytes entering the early commitment phase to apoptosis. J. Biol. Chem. 278:31401–31411. - PubMed
    1. Bisson, C., S. Blacher, M. Polette, J.F. Blanc, F. Kebers, J. Desreux, B. Tetu, J. Rosenbaum, J.M. Foidart, P. Birembaut, and A. Noel. 2003. Restricted expression of membrane type 1-matrix metalloproteinase by myofibroblasts adjacent to human breast cancer cells. Int. J. Cancer. 105:7–13. - PubMed

Publication types

MeSH terms