. 2005 Jan 31;168(3):465-76.
doi: 10.1083/jcb.200407078. Epub 2005 Jan 24.

Ultrastructural identification of uncoated caveolin-independent early endocytic vehicles

Affiliations

Ultrastructural identification of uncoated caveolin-independent early endocytic vehicles

Matthew Kirkham et al. J Cell Biol. .

Abstract

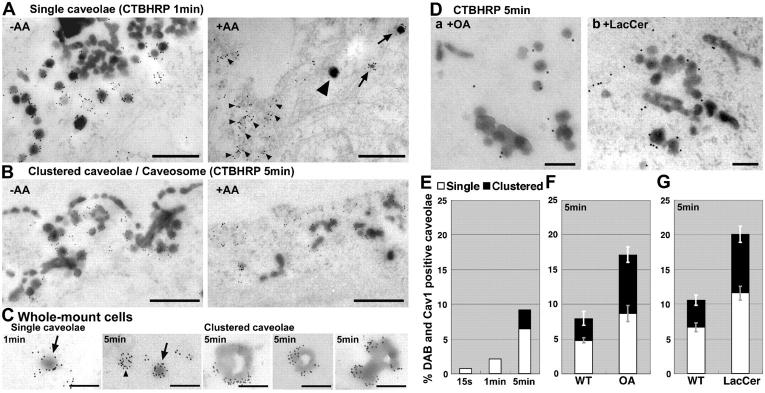
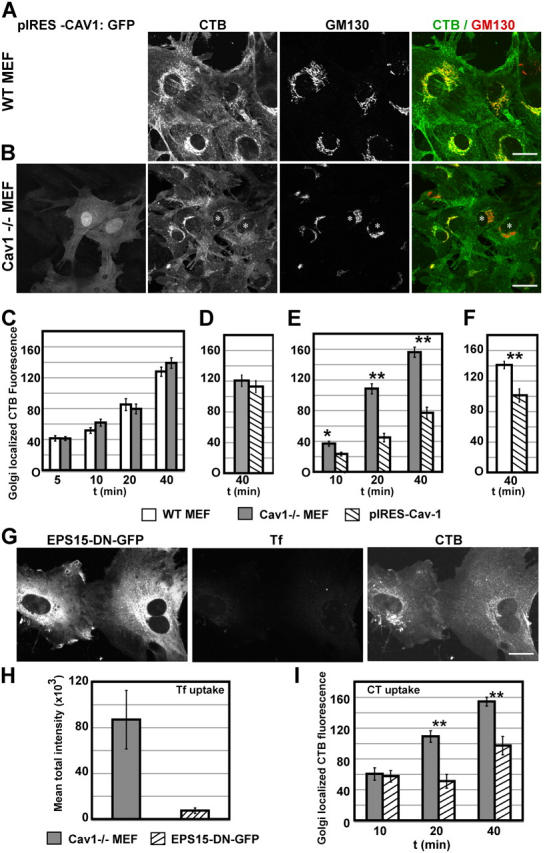
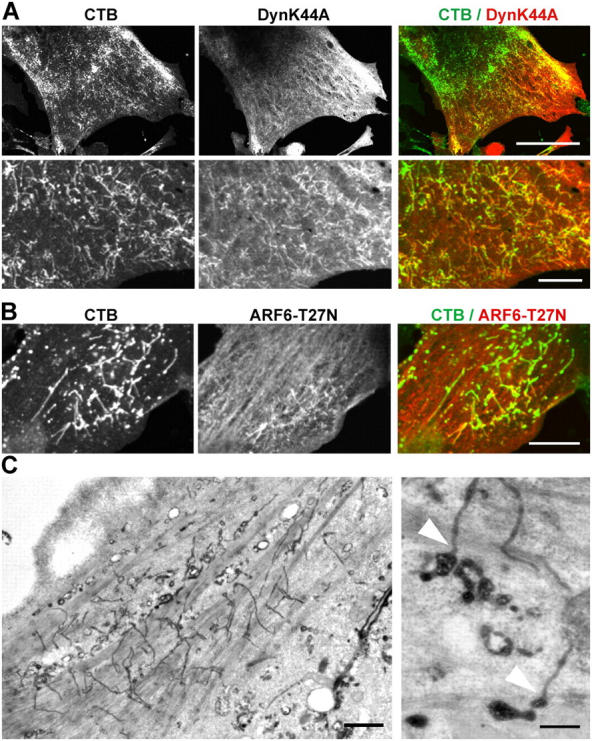
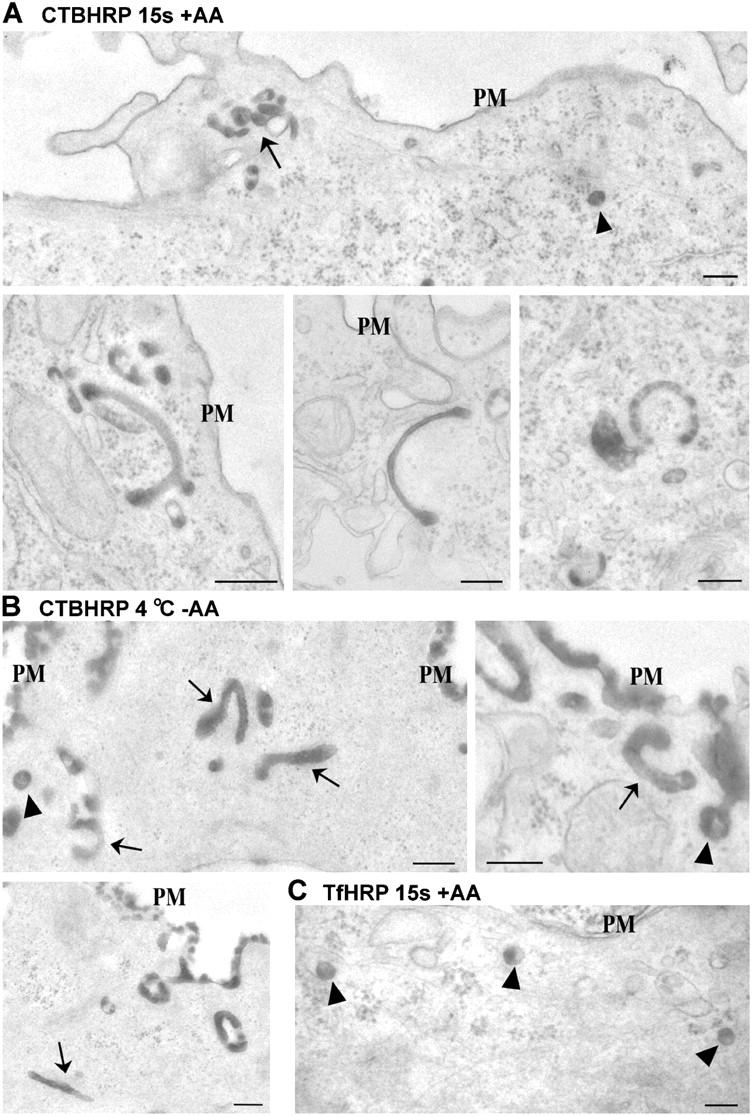
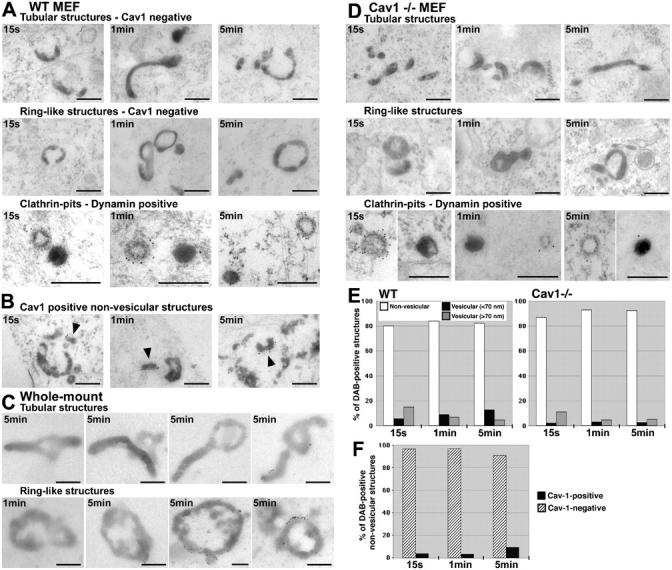
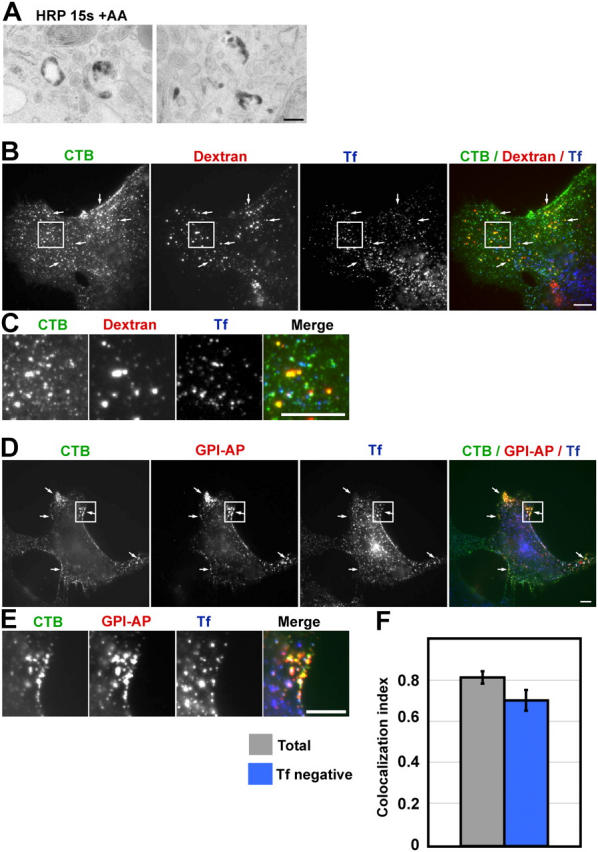
Using quantitative light microscopy and a modified immunoelectron microscopic technique, we have characterized the entry pathway of the cholera toxin binding subunit (CTB) in primary embryonic fibroblasts. CTB trafficking to the Golgi complex was identical in caveolin-1null (Cav1-/-) mouse embryonic fibroblasts (MEFs) and wild-type (WT) MEFs. CTB entry in the Cav1-/- MEFs was predominantly clathrin and dynamin independent but relatively cholesterol dependent. Immunoelectron microscopy was used to quantify budded and surface-connected caveolae and to identify noncaveolar endocytic vehicles. In WT MEFs, a small fraction of the total Cav1-positive structures were shown to bud from the plasma membrane (2% per minute), and budding increased upon okadaic acid or lactosyl ceramide treatment. However, the major carriers involved in initial entry of CTB were identified as uncoated tubular or ring-shaped structures. These carriers contained GPI-anchored proteins and fluid phase markers and represented the major vehicles mediating CTB uptake in both WT and caveolae-null cells.


Figures

Figure 1.
Figure 1.
Ultrastructural characterization of caveolae endocytosis. (A and B) WT MEFs with bound CTBHRP were warmed for 1 (A) or 5 min (B). The DAB reaction was performed on ice in the presence (+AA) or absence (−AA) of AA, and then cells were processed for immunoelectron microscopy detection of Cav1. A and B are representative of areas enriched in caveolae. (A) DAB reaction product is present in a small subset of budded (nonsurface-connected) Cav1-positive caveolae (arrows) in cells treated with AA during the DAB reaction. A large number of caveolae were DAB negative and thus surface connected (small arrowheads). Putative budded clathrin vesicles were also observed (large arrowhead). (B) After 5 min of CTBHRP uptake, Cav1 also localized to DAB-positive internal structures (+AA), which had an irregular tubular morphology (defined operationally as clustered caveolae in E–G). (C) WT MEFs with CTBHRP internalized for either 1 or 5 min were treated with DAB in the presence of AA, labeled for Cav1, and processed for whole-mount visualization. Budded (DAB-positive) caveolae (arrow), surface-connected (DAB-negative) caveolae (arrowhead), and internal Cav1-positive larger structures were observed. (D) WT MEFs were treated as in A but warmed for 5 min in the presence or absence of either OA or LacCer before the DAB reaction in the presence of AA. (E–G) Quantitation of internal caveolae (single or clustered) as compared with the total number of caveolae present in the same area with increasing time of incubation at 37°C (E) or after 5 min at 37°C in the presence/absence of OA (F) or LacCer (G). Error bars indicate standard error. Bars: (A and B) 500 nm; (C and D) 200 nm.
Figure 2.
Figure 2.
Internalization of CTB by WT and Cav1−/− MEFs. (A–F) CTB-FITC was internalized in WT MEFs (A and C) or Cav1−/− MEFs (C) at 37°C for various times, and then fixed and labeled for GM130 (A and C). The accumulation of CTB within the Golgi complex in both WT MEFs and Cav1−/− MEFs was quantified (C); no significant differences were seen. Bars indicate standard error. Cav1−/− MEFs were microinjected with pIRES-Cav-1 using standard conditions (D) and short expression conditions (B and E). (B) Injected cells (*) were marked by the production of cytosolic GFP coded for by the same message as untagged Cav1. CTB-Alexa Fluor 594 was internalized and CTB fluorescence intensity in the GM130-positive region was quantified (D–F). WT MEFs were microinjected with pIRES-Cav-1 using short expression conditions (F). Only short expression of Cav1 reduced CTB trafficking to the Golgi complex as compared with nonexpressing cells in both WT and Cav1−/− MEFs (D–F). (G) Cav1−/− MEFs were microinjected with vectors encoding for EPS15-DN-GFP and TfR for short expression. CTB-FITC was internalized simultaneously with Tf for 40 min. CTB-FITC was labeled with an anti-CT antibody and a secondary antibody conjugated to Alexa Fluor 660. In cells that were injected with EPS15-DN-GFP, Tf uptake was inhibited, but CTB still accumulated in a perinuclear compartment. (H) Cav1−/− MEFs were microinjected with vectors encoding TfR and either GFP or EPS15-DN-GFP (short expression), and then Tf uptake for 20 min was performed. Internal Tf was quantified in injected cells, and EPS15-DN-GFP inhibited Tf uptake by 90%. (I) Cav1−/− MEFs were microinjected with vectors encoding for EPS15-DN-GFP (short expression), and CTB-Alexa Fluor 594 was internalized for various times. Quantification of CTB accumulation in the GM130-positive Golgi complex revealed that EPS15-DN-GFP reduced CTB trafficking by only 40%. Bars indicate standard error; *, P < 0.01; **, P < 0.001. Bars, 25 μm.
Figure 3.
Figure 3.
Dynamin and ARF6 mutants inhibit CTB transport to the Golgi complex. Cav1−/− MEFs were microinjected with cDNA for DynK44A (A) or ARF6 T27N (B and C; short expression). CTB Alexa Fluor 594 was internalized for 40 min (A and B). DynK44A and ARF6 T27N that contained NH2-terminal HA tags were labeled with anti-HA (A and B). CTB colocalizes with DynK44A (A) and ARF6 T27N (B) in an extensive tubular network. This is highlighted in enlargements in bottom panels of A. (C) Cav1−/− MEFs were microinjected with ARF6 T27N and HRP, and CTBHRP was internalized for 40 min at 37°C. Cells were prepared for EM and CTBHRP was revealed by DAB cytochemistry. CTBHRP reaction product was evident within a network of 40-nm-diam tubular structures in the injected cells, some of which connect to multivesicular regions (arrowheads). Bars: (A, top; and B) 25 μm; (A, bottom) 5 μm; (C, left) 1 μM; (C, right) 200 nm.
Figure 4.
Figure 4.
Ultrastructural characterization of early carriers in Cav1−/− MEFs. Cav1−/− MEFs were incubated with CTBHRP (A and B) or TfHRP (C) at 4°C. They were warmed for 15 s at 37°C and DAB treated in the presence of AA (A and C) or were DAB treated in the absence of AA without a warming step to reveal the surface distribution of CTBHRP (B). All samples were fixed and processed for EM without permeabilization. (A) CTBHRP reaction product is evident within vesicular profiles (arrowheads) and tubular/ring-shaped profiles (arrows) close to the plasma membrane (PM). Note the groups of labeled structures as most clearly evident in the low magnification overview (top). (B) CTBHRP reaction product is evident over the entire cell surface but tubular/ring-shaped profiles of similar morphology to those detached from the surface after warming are evident (arrows). Also note the labeling of vesicular profiles connected to the cell surface (arrowheads). (C) In contrast to the structures labeled by CTBHRP after 15 s, TfHRP labels vesicular profiles (arrowheads) close to the PM. Bars, 200 nm.
Figure 5.
Figure 5.
Ultrastructural characterization of early noncaveolar carriers in Cav1−/− MEFs and WT MEFs. WT (A, B, and E) and Cav1−/− (D and E) MEFs with bound CTBHRP were warmed for 15 s, 1 min, or 5 min at 37°C and DAB treated in the presence of AA. Samples were immunolabeled for Cav1 (A–C) or dynamin (clathrin-pit panels) and processed for EM. In both WT (A) and Cav1−/− (D) MEFs, CTBHRP reaction product was observed after 15 s, 1 min, and 5 min in tubular structures, ring-like structures, clathrin coated vesicles, and smaller vesicular structures. (B) In WT MEFs, CTBHRP-positive nonvesicular structures partly colocalized with Cav1. The percentage of nonvesicular structures labeled with Cav1 was quantitated (F). (C) WT MEFs were grown on grids, and CTBHRP was internalized for 5 min. Cells were prepared for whole-mount visualization. CTBHRP labeled short tubular or ring-shaped structures, some of which are Cav1 positive. (E) Internal CTBHRP-positive structures in WT and Cav1−/− MEFs were classified according to morphology (see Materials and methods) and quantitated as a percentage of total labeled structures. Most CTBHRP-labeled internal structures in both WT and Cav1−/− MEFs were nonvesicular. Note that visualized structures of <70 nm diam included caveolae. Bars, 200 nm.
Figure 6.
Figure 6.
Analysis of uptake of CTB, fluid phase markers, and GPI-APs. (A) WT MEFs were incubated with 10 mg/ml HRP as a fluid phase marker for 15 s, and then DAB treated in the presence of AA before being processed for EM. Tubular carriers similar to the early carriers containing CTBHRP are labeled by HRP. (B and C) CTB, dextran, and Tf were cointernalized for 2 min in WT MEFs, and the boxed areas are enlarged in panel C. (D and E) CTB GPI-AP and Tf were cointernalized for 2 min in WT MEFs. CTB colocalization with Tf was observed in ∼50% of CTB-positive structures. Arrows highlight endosomes containing CTB and GPI-AP but not Tf, and the boxed areas are enlarged in panel E. (F) GPI-AP and CTB colocalization were quantified to give a colocalization index. Gray bar, colocalization between all GPI-AP–positive structures and CTB; blue bar, CTB colocalization with GPI-AP–positive Tf-negative structures. Error bars indicate standard error. Bars: (A) 200 nm; (B–E) 10 μm.

References

    1. Anderson, R.G., B.A. Kamen, K.G. Rothberg, and S.W. Lacey. 1992. Potocytosis: sequestration and transport of small molecules by caveolae. Science. 255:410–411. - PubMed
    1. Benmerah, A., M. Bayrou, N. Cerf-Bensussan, and A. Dautry-Varsat. 1999. Inhibition of clathrin coated pit assembly by an Eps15 mutant. J. Cell Sci. 112:1303–1311. - PubMed
    1. Conner, S.D., and S.L. Schmid. 2003. Regulated portals of entry into the cell. Nature. 422:37–44. - PubMed
    1. Damke, H., T. Baba, D.E. Warnock, and S.L. Schmid. 1994. Induction of mutant dynamin specifically blocks endocytic coated vesicle formation. J. Cell Biol. 127:915–934. - PMC - PubMed
    1. Damke, H., T. Baba, A.M. van der Bliek, and S.L. Schmid. 1995. Clathrin-independent pinocytosis is induced in cells overexpressing a temperature-sensitive mutant of dynamin. J. Cell Biol. 131:69–80. - PMC - PubMed

Publication types

MeSH terms

Substances