. 2005 Feb 1;102(5):1590-5.
doi: 10.1073/pnas.0406289102. Epub 2005 Jan 24.

Genomic instability, endoreduplication, and diminished Ig class-switch recombination in B cells lacking Nbs1

Affiliations

Genomic instability, endoreduplication, and diminished Ig class-switch recombination in B cells lacking Nbs1

Bernardo Reina-San-Martin et al. Proc Natl Acad Sci U S A. .

Abstract

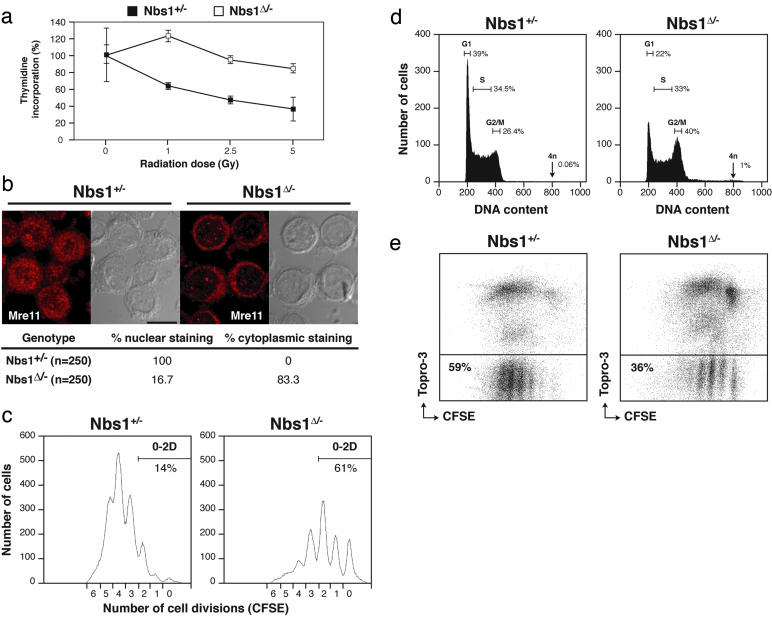
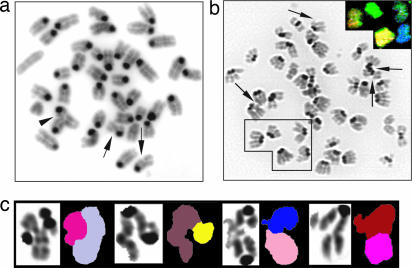
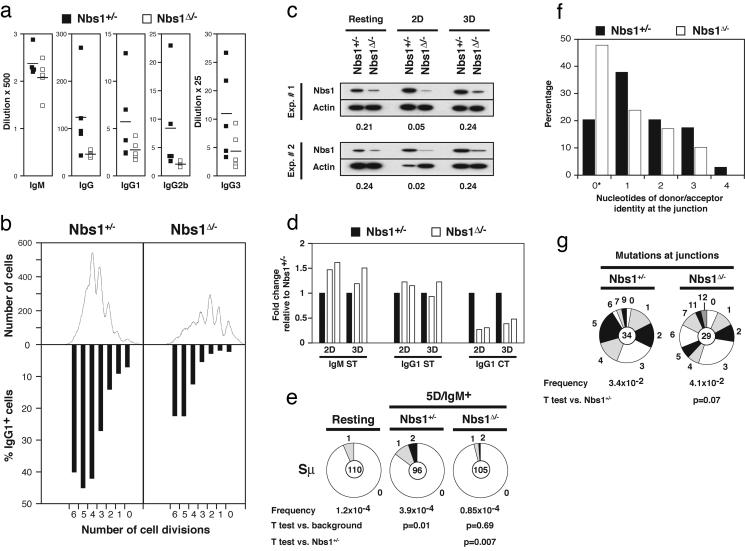
Mre11, Rad50, and Nbs1 form an evolutionarily conserved protein complex (Mre11-Rad50-Nbs1, MRN) that has been proposed to function as a DNA damage sensor. Hypomorphic mutations in Mre11 and Nbs1 result in the human ataxia-telangiectasia-like disorder and Nijmegen breakage syndrome (NBS), respectively. In contrast, complete inactivation of Mre11, Rad50, or Nbs1 leads to early embryonic lethality, suggesting that the hypomorphic mutations may fail to reveal some of the essential functions of MRN. Here, we use Cre-loxP-mediated recombination to restrict Nbs1 deletion to B lymphocytes. We find that disruption of Nbs1 results in the accumulation of high levels of spontaneous DNA damage, impaired proliferation, and chromosomal endoreduplication. Moreover, we show that Ig class-switch recombination (CSR) is diminished in Nbs1-deficient B cells. The CSR defect is B cell-intrinsic, independent of switch-region transcription, and a consequence of inefficient recombination at the DNA level. Our findings reveal that Nbs1 is critical for efficient Ig CSR and maintenance of the integrity of chromosomal structure and number.


Figures

Fig. 1.
Fig. 1.
Abnormal cell-cycle progression, proliferation, and increased mortality in Nbs1Δ/- B cells. (a) Thymidine incorporation after γ-irradiation of Nbs1+/- (▪) and Nbs1Δ/- (□) B cells stimulated for 48 h with LPS and IL-4. Data from triplicates are normalized to the counts in unirradiated samples of the same genotype. (b) Distribution of Mre11 in Nbs1Δ/- and Nbs1+/- B cells stimulated for 48 h with LPS and IL-4. Confocal images were optically sectioned at 0.5-μm intervals and merged into a maximum projection. The percentage of cells with nuclear or cytoplasmic staining is indicated. (c) Flow-cytometric analysis of cell division as measured by CFSE dye dilution in Nbs1Δ/- and Nbs1+/- B cells stimulated for 72 h with LPS and IL-4. Percentage of cells having undergone 0, 1, and 2 divisions is indicated. (d) Flow-cytometric analysis of DNA content in Nbs1Δ/- and Nbs1+/- B cells stimulated for 48 h with LPS and IL-4. Percentage of cells in G1, S, and G2/M phases of the cell cycle and with a DNA content of 4n is indicated. Representative histograms from five independent experiments are shown. The percentage of cells with 4n DNA content was 1 ± 0.11% in Nbs1Δ/- and 0.06 ± 0.01% in Nbs1+/-cells. (e) Cell viability of CFSE-labeled Nbs1Δ/- and Nbs1+/- B cells after 60 h in culture with LPS and IL-4 as determined by flow cytometry. Percentage of live (Topro-3-negative) CFSE+ cells is indicated.
Fig. 2.
Fig. 2.
Chromosomal instability in Nbs1Δ/- B cells. (a) Representative metaphase prepared from Nbs1Δ/- (CD19cre+Nbs1-/loxP) B cells after 2 days of stimulation with LPS and IL-4. Arrows indicate chromatid breaks; arrowhead indicates a radial structure. (b) An example of endoreduplication in Nbs1Δ/- cells. Spectral-karyotype analysis shows that all four sister chromatids are paired (Inset). Arrows indicate chromatid breaks. (c) Examples of radial-type chromosome structures in which genetic material is exchanged between nonhomologous chromosomes. Results are derived from two independent experiments.
Fig. 3.
Fig. 3.
Impaired CSR in Nbs1Δ/- B cells. (a) Sera from 5- to 8-week-old Nbs1Δ/- (CD19cre+Nbs1-/loxP, □) and age-matched Nbs1+/- (CD19cre+Nbs1+/-, ▪) mice were collected, and total IgM, IgG, IgG1, IgG2b, and IgG3 levels were determined by ELISA. Data are plotted as the average dilution that gave half-maximum optical density in five mice of each genotype. (b) Flow-cytometric analysis of Nbs1Δ/- and Nbs1+/- B cells stimulated with LPS and IL-4 for 3 days. Cell division as measured by CFSE dye dilution is shown in Upper. The percentage of cells expressing IgG1 after a specific number of cell divisions is indicated in Lower. (c) Western blot analysis of murine Nbs1 in whole-cell extracts prepared from purified splenic B cells before stimulation and sorted for two or three cell divisions after stimulation with LPS and IL-4 (2D and 3D, respectively). Numbers reflect the intensity of bands representing Nbs1 protein in Nbs1Δ/- relative to Nbs1+/- after normalization to actin. Data from two independent experiments are shown. (d) Real-time RT-PCR for IgM sterile transcript (IgM ST), IgG1 sterile transcript (IgG1 ST), and IgG1 circle transcript after switch (IgG1 CT) in Nbs1+/- (filled bars) and Nbs1Δ/- (open bars) B cells stimulated with LPS and IL-4 and sorted after two or three cell divisions (2D and 3D, respectively). Results from two independent experiments are expressed as fold change relative to Nbs1+/- after normalization to GAPDH. (e) Mutations in Sμ determined in Nbs1+/- and Nbs1Δ/- IgM+ B cells sorted for five cell divisions. Segment sizes in the pie charts are proportional to the number of sequences carrying the number of mutations indicated in the periphery of the charts. The mutation frequency and the total number of independent sequences that were analyzed are indicated below and in the center of each chart, respectively. Statistical significance was determined by a two-tailed t test assuming unequal variance and by comparing with resting B cells from wild-type mice (Nbs1+/-, P = 0.01; Nbs1Δ/-, P = 0.69) or comparing Nbs1+/- with Nbs1Δ/-(P = 0.007). The number of mutations was as follows: Nbs1+/-, 20 mutations, 51,304 bp; Nbs1Δ/-, five mutations, 58,800 bp. (f) Histogram depicting the percentage of sequences with the indicated length of microhomologies at Sμ/Sγ1 junctions in Nbs1+/- (filled bars) and Nbs1Δ/- (open bars) B cells. Overlap was determined by identifying the longest region at the switch junction of perfect uninterrupted donor/acceptor identity. Statistical significance was determined by Student's one-tailed t test (P = 0.07). *, Includes junction sequences with small 2- to 4-bp insertions (Nbs1+/-,2/34; Nbs1Δ/-,4/29). (g) Mutations in the vicinity of the junctions obtained from Nbs1+/- and Nbs1Δ/- B cells. Statistical significance was determined by a two-tailed t test assuming unequal variance and comparing Nbs1+/- with Nbs1Δ/-(P = 0.28).

References

    1. Li, Z., Woo, C. J., Iglesias-Ussel, M. D., Ronai, D. & Scharff, M. D. (2004) Genes Dev. 18, 1-11. - PubMed
    1. Chaudhuri, J. & Alt, F. W. (2004) Nat. Rev. Immunol. 4, 541-552. - PubMed
    1. Muramatsu, M., Kinoshita, K., Fagarasan, S., Yamada, S., Shinkai, Y. & Honjo, T. (2000) Cell 102, 553-563. - PubMed
    1. Revy, P., Muto, T., Levy, Y., Geissmann, F., Plebani, A., Sanal, O., Catalan, N., Forveille, M., Dufourcq-Labelouse, R., Gennery, A., et al. (2000) Cell 102, 565-575. - PubMed
    1. Neuberger, M. S., Harris, R. S., Di Noia, J. & Petersen-Mahrt, S. K. (2003) Trends Biochem. Sci. 28, 305-312. - PubMed

Publication types

MeSH terms

Substances