

The expected burden of mesothelioma mortality in Great Britain from 2002 to 2050
- PMID: 15668716
- PMCID: PMC2362088
- DOI: 10.1038/sj.bjc.6602307
The expected burden of mesothelioma mortality in Great Britain from 2002 to 2050
Abstract
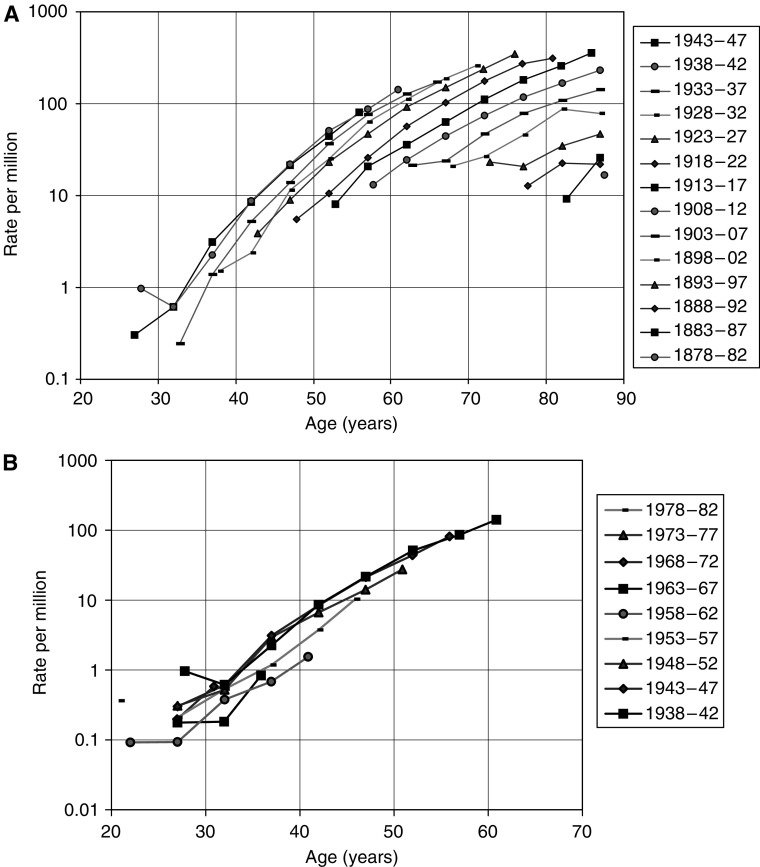
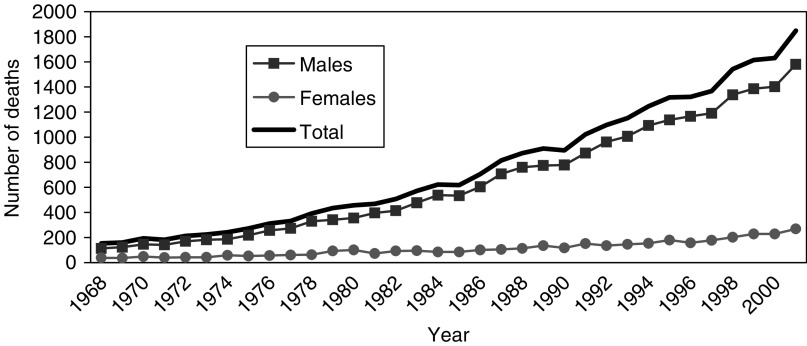
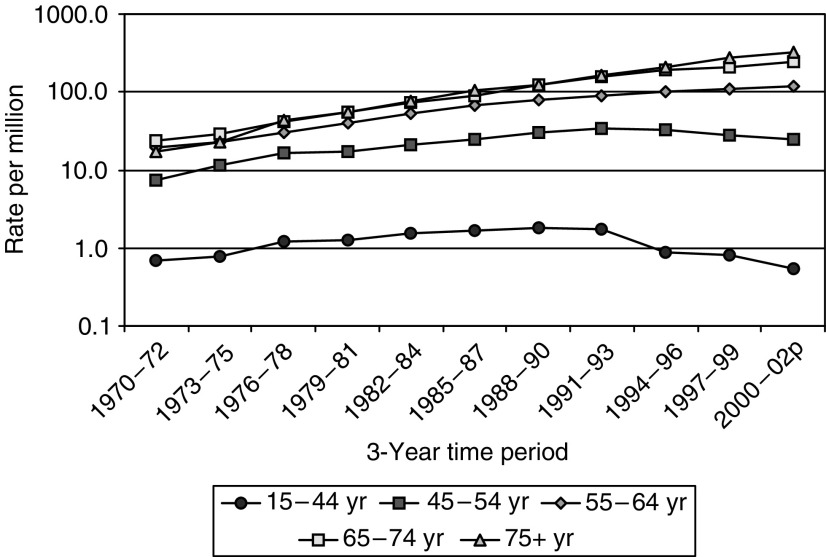
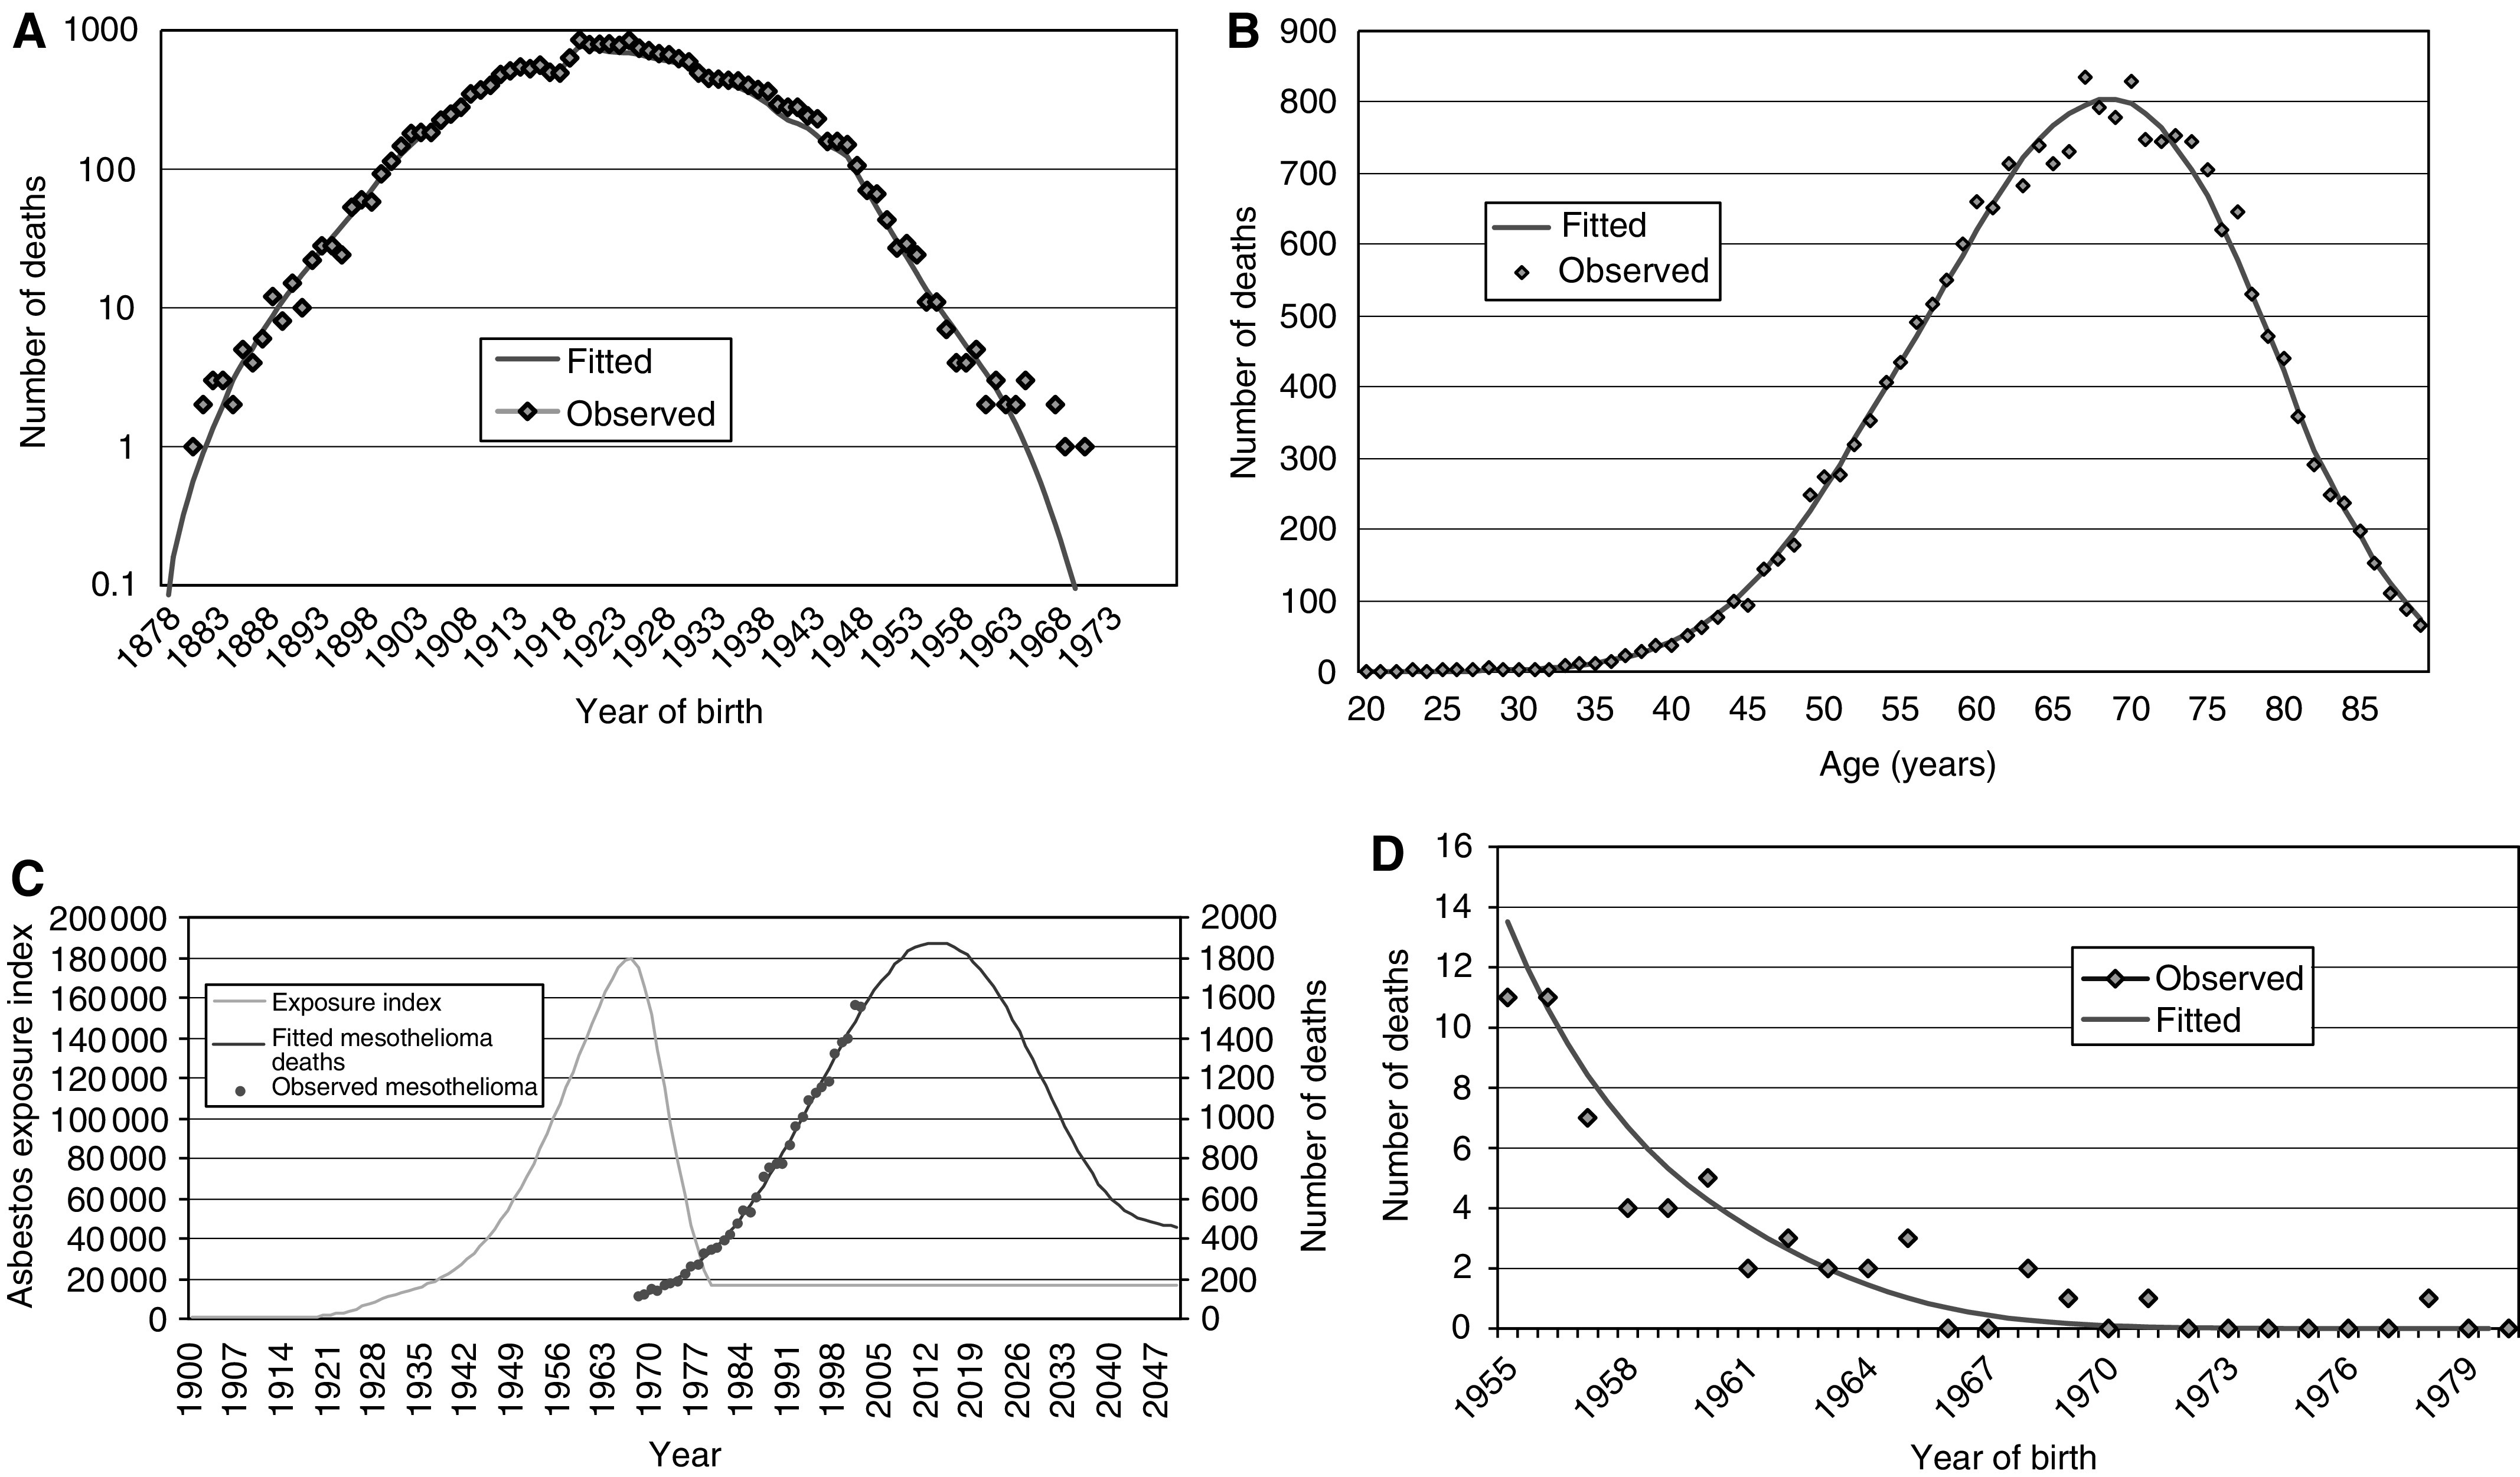
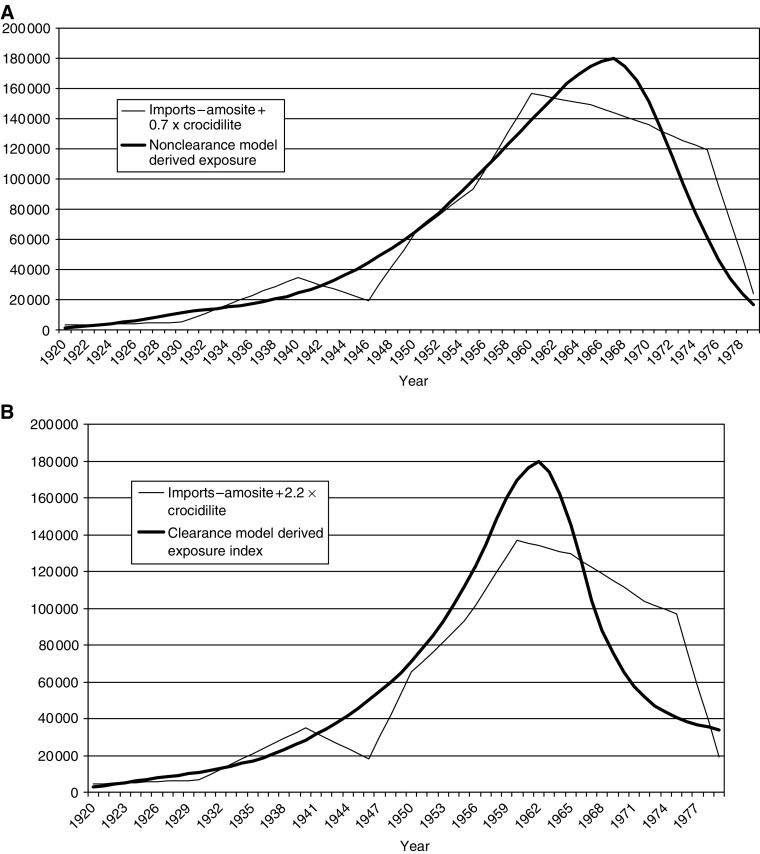
The British mesothelioma register contains all deaths from 1968 to 2001 where mesothelioma was mentioned on the death certificate. These data were used to predict the future burden of mesothelioma mortality in Great Britain. Poisson regression analysis was used to model male mesothelioma deaths from 1968 to 2001 as a function of the rise and fall of asbestos exposure during the 20th century, and hence to predict numbers of male deaths in the years 2002-2050. The annual number of mesothelioma deaths in Great Britain has risen increasingly rapidly from 153 deaths in 1968 to 1848 in 2001 and, using our preferred model, is predicted to peak at around 1950 to 2450 deaths per year between 2011 and 2015. Following this peak, the number of deaths is expected to decline rapidly. The eventual death rate will depend on the background level and any residual asbestos exposure. Between 1968 and 2050, there will have been approximately 90,000 deaths from mesothelioma in Great Britain, 65,000 of which will occur after 2001.
Figures
References
-
- Bianchi C, Giarelli L, Grandi G, Brollo A, Ramani L, Zuch C (1997) Latency periods in asbestos-related mesothelioma of the pleura. Eur J Cancer Prev 6: 162–166 - PubMed
-
- Doll R, Peto J (1985) Effects on Health of Exposure to Asbestos. London: HMSO
-
- Health Effects Institute (1991) Asbestos in Public and Commercial Buildings: A Literature Review and Synthesis of Current Knowledge. Cambridge, MA: Health Effects Institute – Asbestos Research
MeSH terms
Substances
LinkOut - more resources
Full Text Sources
Medical
