

HIV-1-specific CD4+ T lymphocyte turnover and activation increase upon viral rebound
- PMID: 15668739
- PMCID: PMC544605
- DOI: 10.1172/JCI23084
HIV-1-specific CD4+ T lymphocyte turnover and activation increase upon viral rebound
Abstract
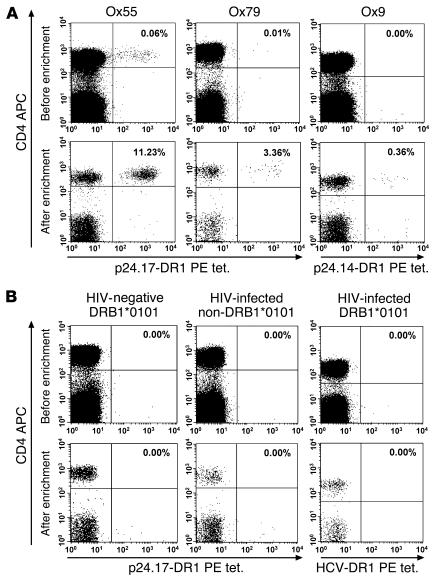
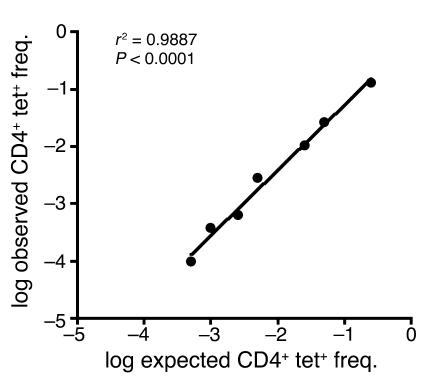
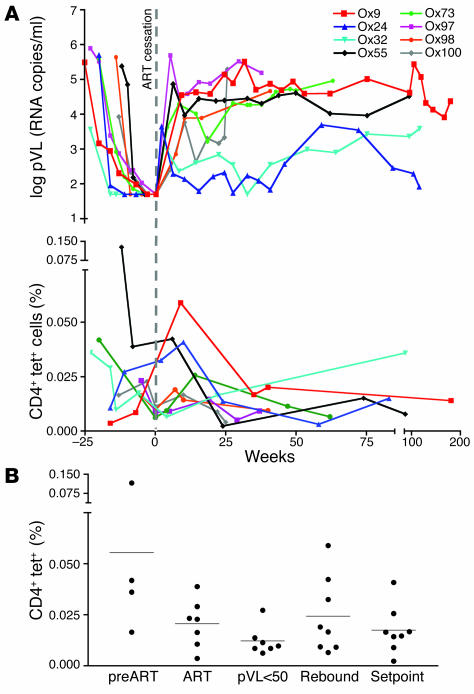
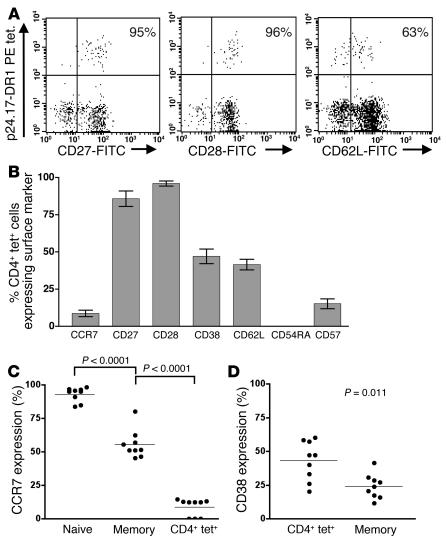
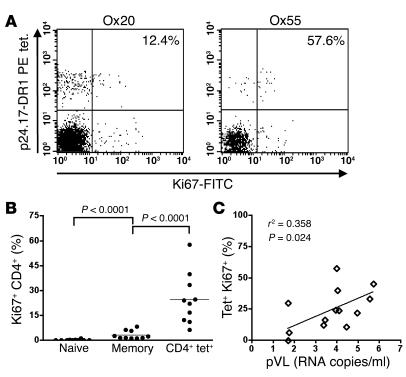
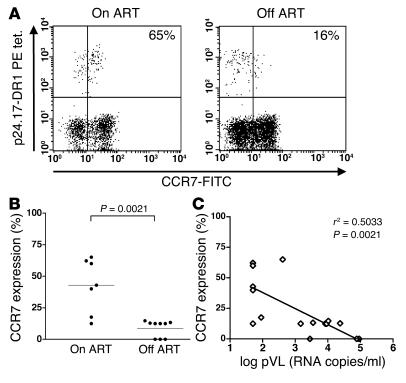
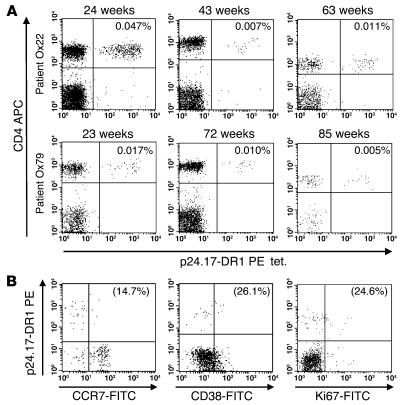
HIV-specific CD4+ T helper lymphocytes are preferred targets for infection. Although complete interruption of combination antiretroviral therapy (ART) can form part of therapeutic manipulations, there is grave concern that the resumption of viral replication might destroy, perhaps irreversibly, these T helper populations. High viremia blocks the proliferation capacity of HIV-specific helper cells. However, cytokine production assays imply that some antigen-specific effector function is retained. Despite this careful work, it remains unclear whether the return of HIV-1 replication physically destroys HIV-1-specific T helper cells in the peripheral blood. Difficulties in producing stable peptide-MHC class II complexes and the very low frequencies of antigen-specific CD4+ T cells have delayed the application of this powerful technique. Here we employ HLA class II tetramers and validate a sensitive, quantitative cell-enrichment technique to detect HIV-1 T helper cells. We studied patients with early-stage HIV infection who were given a short, fixed course of ART as part of a clinical study. We did not find significant deletion of these cells from the peripheral circulation when ART was stopped and unfettered HIV replication returned. The turnover of these virus-specific cells increased and they adopted an effector phenotype when viremia returned.
Figures
Similar articles
-
High-level HIV-1 viremia suppresses viral antigen-specific CD4(+) T cell proliferation.Proc Natl Acad Sci U S A. 2001 Nov 20;98(24):13878-83. doi: 10.1073/pnas.251539598. Proc Natl Acad Sci U S A. 2001. PMID: 11717444 Free PMC article.
-
Suppression of viral replication with highly active antiretroviral therapy has no impact on the functional profile of HIV-specific CD8(+) T cells.Eur J Immunol. 2008 Jun;38(6):1548-58. doi: 10.1002/eji.200738054. Eur J Immunol. 2008. PMID: 18421792
-
HIV-1 viral replication below 50 copies/ml in patients on antiretroviral therapy is not associated with CD8+ T-cell activation.Antivir Ther. 2007;12(6):971-5. Antivir Ther. 2007. PMID: 17926652
-
Failure to reconstitute CD4+ T-cells despite suppression of HIV replication under HAART.AIDS Rev. 2006 Apr-Jun;8(2):88-97. AIDS Rev. 2006. PMID: 16848276 Review.
-
HIV type 1-specific helper T cells: a critical host defense.AIDS Res Hum Retroviruses. 1998 Jun;14 Suppl 2:S143-7. AIDS Res Hum Retroviruses. 1998. PMID: 9672231 Review. No abstract available.
Cited by
-
Human immunodeficiency virus (HIV)-specific T helper responses fail to predict CD4+ T cell decline following short-course treatment at primary HIV-1 infection.Clin Exp Immunol. 2008 Jun;152(3):532-7. doi: 10.1111/j.1365-2249.2008.03653.x. Epub 2008 Apr 16. Clin Exp Immunol. 2008. PMID: 18422732 Free PMC article. Clinical Trial.
-
HIV controllers maintain a population of highly efficient Th1 effector cells in contrast to patients treated in the long term.J Virol. 2012 Oct;86(19):10661-74. doi: 10.1128/JVI.00056-12. Epub 2012 Jul 25. J Virol. 2012. PMID: 22837194 Free PMC article.
-
Polymorphisms of IL-6 174 G/C, IL-10 -592 C/A and risk of HIV/AIDS among North Indian population.Mol Cell Biochem. 2010 Apr;337(1-2):145-52. doi: 10.1007/s11010-009-0293-0. Mol Cell Biochem. 2010. PMID: 19936625
-
Class II major histocompatibility complex tetramer staining: progress, problems, and prospects.Immunology. 2008 Mar;123(3):305-13. doi: 10.1111/j.1365-2567.2007.02801.x. Immunology. 2008. PMID: 18251991 Free PMC article. Review.
-
CD4+ T cell targeting of human immunodeficiency virus type 1 (HIV-1) peptide sequences present in vivo during chronic, progressive HIV-1 disease.Virology. 2007 Apr 25;361(1):34-44. doi: 10.1016/j.virol.2006.10.040. Epub 2006 Dec 13. Virology. 2007. PMID: 17169395 Free PMC article.
References
Publication types
MeSH terms
Substances
LinkOut - more resources
Full Text Sources
Other Literature Sources
Medical
Research Materials
