. 2005 Jun 1;388(Pt 2):465-73.
doi: 10.1042/BJ20041682.

Anti-inflammatory potential of CB1-mediated cAMP elevation in mast cells

Affiliations

Anti-inflammatory potential of CB1-mediated cAMP elevation in mast cells

Andrea L Small-Howard et al. Biochem J. .

Abstract

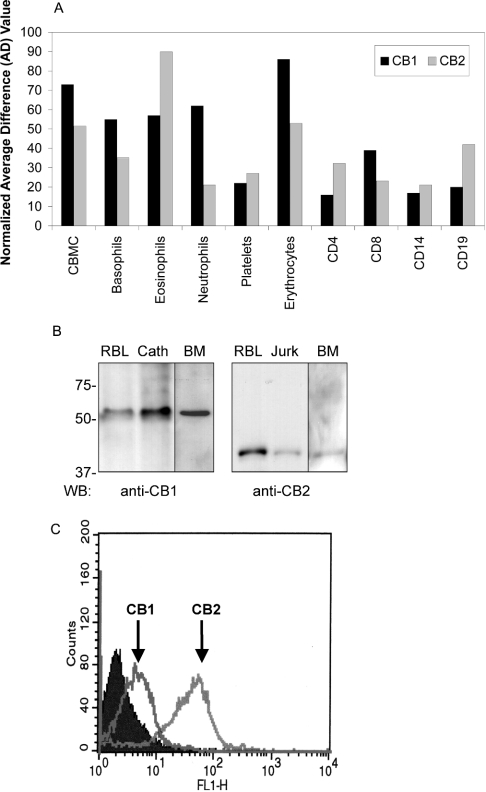
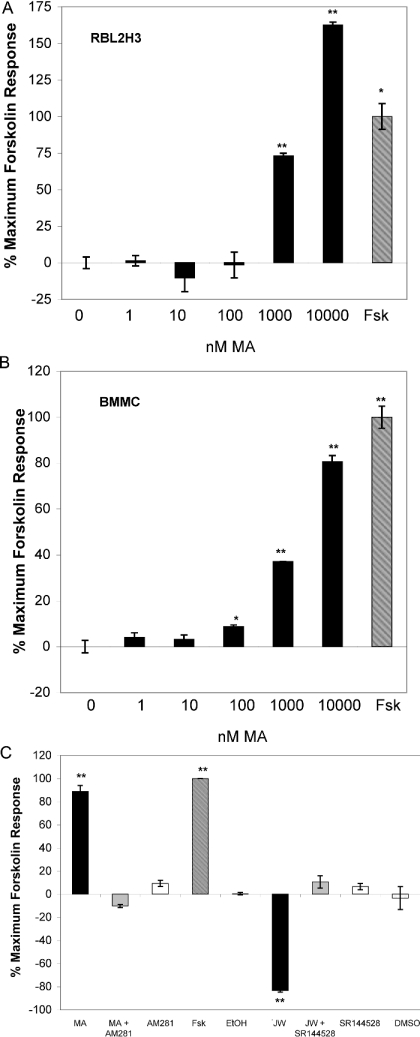
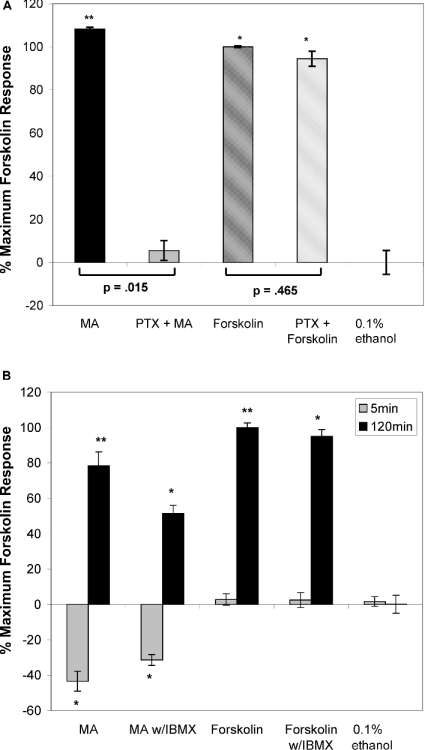
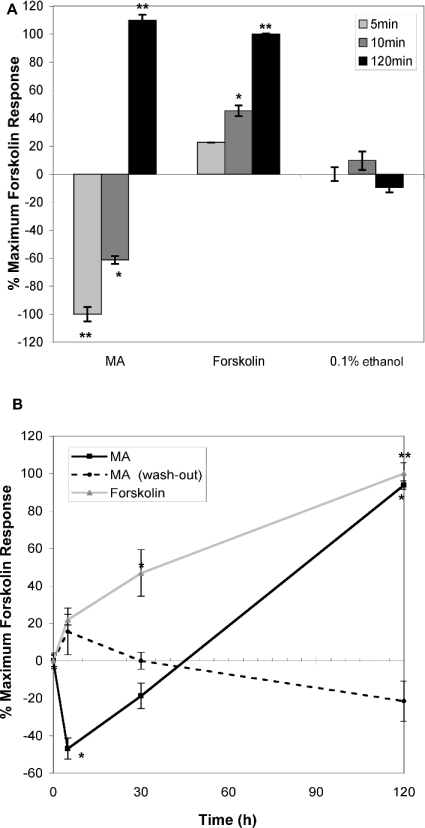
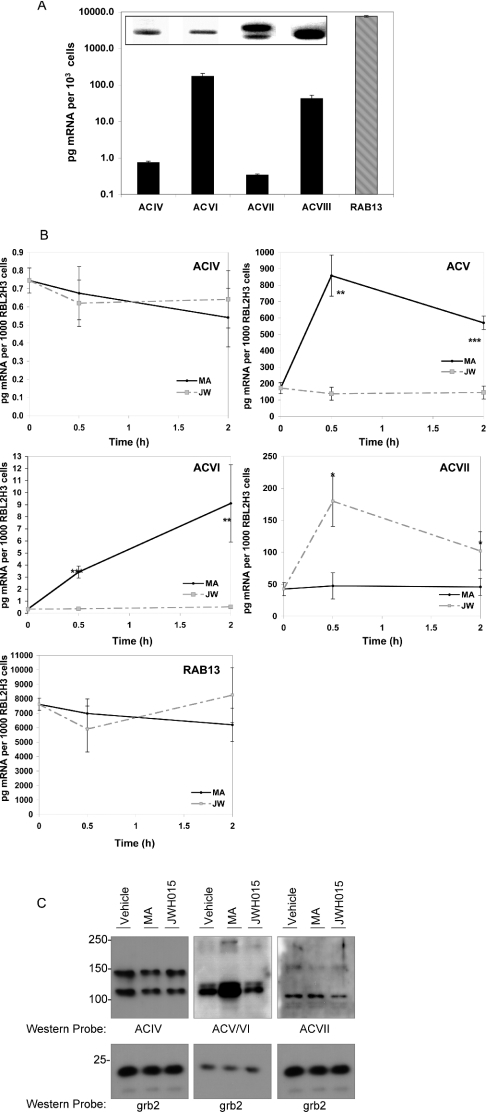
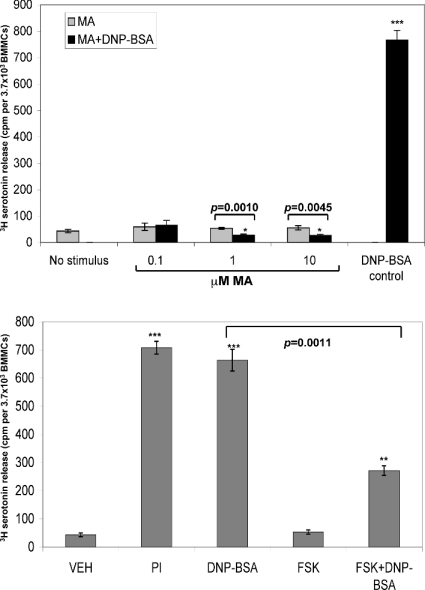
Cannabinoids are broadly immunosuppressive, and anti-inflammatory properties have been reported for certain marijuana constituents and endogenously produced cannabinoids. The CB2 cannabinoid receptor is an established constituent of immune system cells, and we have recently established that the CB1 cannabinoid receptor is expressed in mast cells. In the present study, we sought to define a role for CB1 in mast cells and to identify the signalling pathways that may mediate the suppressive effects of CB1 ligation on mast cell activation. Our results show that CB1 and CB2 mediate diametrically opposed effects on cAMP levels in mast cells. The observed long-term stimulation of cAMP levels by the Galpha(i/o)-coupled CB1 is paradoxical, and our results indicate that it may be attributed to CB1-mediated transcriptional regulation of specific adenylate cyclase isoenzymes that exhibit superactivatable kinetics. Taken together, these results reveal the complexity in signalling of natively co-expressed cannabinoid receptors and suggest that some anti-inflammatory effects of CB1 ligands may be attributable to sustained cAMP elevation that, in turn, causes suppression of mast cell degranulation.


Figures

Figure 1
Figure 1. Cannabinoid receptor subtype 1 (CB1) expression in primary and transformed mast cells
(A) Transcript levels for CB1 and CB2 in human haematopoietic cells. Hybridization data were extracted from human genome-wide expression analysis (Affymetrix U133A) array and probed with cDNA derived from the indicated cell sources. CBMCs (cord blood derived mast cells) were derived from human CD34+ cord blood progenitor cells. Basophil populations were isolated from peripheral human blood buffy coat by Percoll gradient separation and negative selection. CD14+ monocyte/macrophages were purified from peripheral blood using positive selection. Black bars indicate hybridization to hCB1 (NM016083) and grey bars indicate hybridization to hCB2 (NM001841) gene spots. Data are expressed as fold increases in hybridization relative to normalized background hybridization levels from one representative experiment. (B) Western-blot analysis of CB1 and CB2 protein expression in RBL2H3 mast cells and primary BMMCs. Left panel: post-nuclear lysates from 2×10⁶ RBL2H3 (RBL), Cath.a cells (neuronal positive control for CB1 expression), and 1×10⁷ murine primary BMMCs (BM) were acetone precipitated to recover protein, and resolved by SDS/PAGE (10% polyacrylamide). After electrotransfer to PVDF, Western blotting was performed using 0.1 μg/ml rabbit polyclonal anti-CB1. Predicted molecular mass of CB1 is 53 kDa. Right panel: post-nuclear lysates from 2×10⁶ RBL2H3 (RBL) or Jurkat (lymphocyte positive control for CB2 expression) cells were acetone precipitated to recover protein, and resolved by SDS/PAGE (10% polyacrylamide). After electrotransfer to PVDF, Western blotting was performed using 0.5 μg/ml rabbit polyclonal anti-CB2. The predicted molecular mass of CB2 is 38 kDa. Molecular mass markers are shown in kDa. n=5 for RBL2H3 and Cath.a and n=2 for BMMC. (C) Flow cytometry analysis of CB1 and CB2 surface expression in RBL2H3 mast cells. Intact RBL2H3 were stained using anti-CB1 or anti-CB2 antibodies as described in the Experimental section. Antibody epitopes are peptides derived from the extreme amino-terminal (extracellular) domains of CB1 and CB2 respectively. Positive staining in intact, non-permeabilized cells therefore represents possible surface localization of CB1 and CB2. Staining was visualized using an Alexa-488 conjugated donkey anti-mouse IgG secondary antibody. Filled area represents secondary antibody staining control. Open areas represent cell samples stained, separately, for CB1 or CB2 as indicated (n=2).
Figure 2
Figure 2. CB1 ligands increase intracellular cAMP levels in mast cells
(A) Dose–response analysis of cAMP responses to CB1-selective ligand in RBL2H3 mast cells. Adherent RBL2H3 cells were incubated with 25 μM FSK or with the indicated concentrations of the CB1 agonist (MA) for 120 min at 37 °C. Baseline [cAMP] was 12.6 pmoles/1×104 cells, representing vehicle stimulated levels. Data are expressed as percentage of the maximal attained FSK response in the experiment (n=5). (B) Dose–response analysis of cAMP responses to CB1-selective ligand in primary murine BMMCs. Primary BMMCs were prepared from mouse femurs and expanded in interleukin-3-containing media until a homogeneous mast cell population was obtained. BMMCs were incubated with 25 μM FSK, or with the indicated concentrations of the CB1 agonist (MA) for 120 min at 37 °C. Baseline [cAMP] was 1.9 pmol/104 cells, representing vehicle stimulated levels. Data are represented as percentage of the maximal attained FSK response in the experiment (n=3). (C) Receptor-specific antagonism of MA and JWH015-induced cAMP responses in mast cells. Primary BMMCs were prepared from mouse femurs and expanded in interleukin-3-containing media until a homogeneous mast cell population was obtained. Adherent BMMCs were incubated with 25 μM FSK, or with 10 μM MA or 10 μM JWH015. These stimulations were performed in the absence or in the presence of preapplied (10 min at 37 °C) AM281 (10 μM, CB1 antagonist) or SR144528 (10 μM, CB2 antagonist). Levels of cAMP at 120 min after stimulation were measured as described above (n=3).
Figure 3
Figure 3. CB1-mediated signalling requires Gαi/o
(A) CB1-mediated increase in cAMP levels is attributable to signalling through Gαi/o. Adherent RBL2H3 cells were preincubated with 100 ng/ml PTX, or vehicle, for 16 h at 37 °C. Cells were then incubated with 20 μM MA (CB1-selective ligand), or 25 μM FSK (positive control) for 120 min at 37 °C. cAMP levels were assayed as described above. Baseline cytosolic cAMP level in untreated control cells was 11.8 pmol/105 cells (n=2). (B) Preblockade of PDE activity using IBMX does not prevent MA-induced increase in cytosolic cAMP levels. Adherent RBL2H3 cells were preincubated with 0.5 μM IBMX, or vehicle, for 30 min at 37 °C. Cells were then incubated with 20 μM MA for 0, 5 and 120 min at 37 °C. cAMP levels were assayed as described in the Experimental section (n=2).
Figure 4
Figure 4. CB1-mediated cAMP response in mast cells exhibits adenylate cyclase superactivation kinetics
(A) Acute versus chronic effects of CB1 ligand on cytosolic cAMP levels in RBL2H3. Adherent RBL2H3 cells were incubated with 25 μM FSK, 20 μM MA and vehicle for 5, 10 or 120 min at 37 °C. cAMP levels were assayed as above. Baseline cAMP level in untreated cells was 12.8 pmol/105 cells (n=5). (B) Persistent ligand application is required for stimulation of cAMP levels in response to MA. Adherent RBL2H3 cells were incubated with 20 μM MA for 0, 5, 30 or 120 min at 37 °C and assayed as described above (black line) or with 25 μM FSK (grey line). Alternatively, RBL2H3 cells were incubated with 20 μM MA for 0, 5, 30 or 120 min, then washed three times with culture media and incubated in the fresh media for 120 min before lysis for the cAMP assay (broken line). cAMP levels were assayed as described in the Experimental section. Baseline cAMP level in untreated cells was 10.67 pmol/1×104 cells (n=2).
Figure 5
Figure 5. Representation and transcriptional regulation of superactivatable adenylate cyclase isoforms in mast cells
(A) Relative mRNA levels of AC isoenzymes in RBL2H3 cells. Quantitative RT–PCR was used to assess the relative quantities of mRNA for the AC isoforms (ACIV–ACVII) present in resting RBL2H3. Results are given in pg of mRNA/1×103 cells, based on an external standard curve. RAB13 was used as an internal control gene; however, the AC isoenzyme values were not normalized to this reference value (n=4). Inset: RT–PCR analysis of AC isoenzyme expression in resting RBL2H3. Two sets of specific primers were designed for each of the nine isoforms of AC. Poly(A)+ mRNA was amplified with the relevant primer pairs at optimized temperatures. Products were resolved by 1.5% agarose electrophoresis. This gel depicts the single products (all ∼150 bp) that were observed in reactions in which ACIV, ACV, ACVI and ACVII primers were
Figure 6
Figure 6. Sustained cAMP elevation suppresses secretion responses in mast cells
(A) CB1 mediated suppression of mast cell degranulation. BMMCs were plated at a density of 1×10⁵ cells/cm2 and loaded with [3H]-5-hydroxytryptamine. All cells were primed with 1 μg/ml IgE anti-DNP for 16 h before the start of the experiment. Cells were then exposed to the indicated stimuli for 60 min. IgE/DNP stimulation comprises antigenic cross-linking of the FcεRI using 200 ng/ml DNP/BSA. MA (at the indicated doses) was applied for 45 min before the addition of DNP/BSA. After 60 min at 37 °C, supernatants were harvested and the secreted 5-hydroxytryptamine levels were assayed by liquid scintillation counting. Data are expressed as c.p.m./3.7×103 BMMCs (n=3). (B) FSK treatment suppresses mast cell degranulation. BMMCs were plated at a density of 1×10⁵ cells/cm2 and loaded with [3H]-5-hydroxytryptamine. All cells were primed with 1 μg/ml IgE anti-DNP for 16 h before the start of the experiment. Cells were then exposed to the indicated stimuli for 60 min. IgE/DNP stimulation comprises antigenic cross-linking of the FcεRI using 200 ng/ml DNP/BSA. PI [(1 μM phorbol ester)/(500 nM ionomycin)] treatment to elicit maximal secretion. FSK (25 μM) was applied for 45 min before the addition of DNP/BSA. After 60 min at 37 °C, supernatants were harvested and secreted 5-hydroxytryptamine levels were assayed by liquid scintillation counting. Data are expressed as c.p.m./3.7×103 BMMCs (n=2).

Similar articles

Cited by

References

    1. Galli S. J. Mast cells and basophils. Curr. Opin. Hematol. 2000;7:32–39. - PubMed
    1. Galli S. J., Wedemeyer J., Tsai M. Analyzing the roles of mast cells and basophils in host defense and other biological responses. Int. J. Hematol. 2002;75:363–369. - PubMed
    1. Roth M. D., Arora A., Barsky S. H., Kleerup E. C., Simmons M., Tashkin D. P. Airway inflammation in young marijuana and tobacco smokers. Am. J. Respir. Crit. Care Med. 1998;157:928–937. - PubMed
    1. Sharma B. B., Apgar J. R., Liu F. T. Mast cells. Receptors, secretagogues, and signaling. Clin. Rev. Allergy Immunol. 2002;22:119–148. - PubMed
    1. Wedemeyer J., Tsai M., Galli S. J. Roles of mast cells and basophils in innate and acquired immunity. Curr. Opin. Immunol. 2000;12:624–631. - PubMed

Publication types

MeSH terms