. 2005 Feb 1;102(5):1442-7.
doi: 10.1073/pnas.0409532102. Epub 2005 Jan 25.

Functional antagonism of different G protein-coupled receptor kinases for beta-arrestin-mediated angiotensin II receptor signaling

Affiliations

Functional antagonism of different G protein-coupled receptor kinases for beta-arrestin-mediated angiotensin II receptor signaling

Jihee Kim et al. Proc Natl Acad Sci U S A. .

Abstract

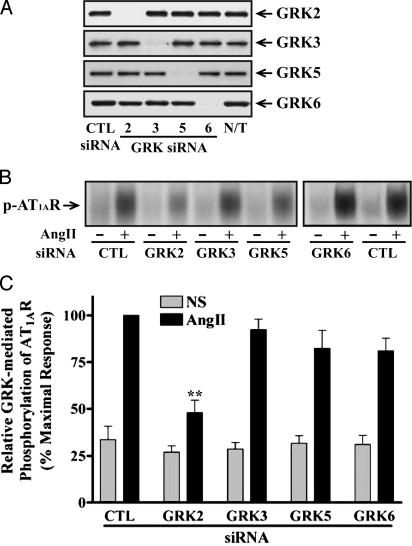
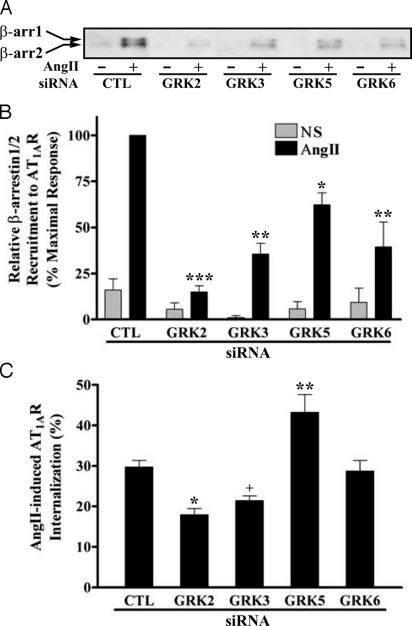
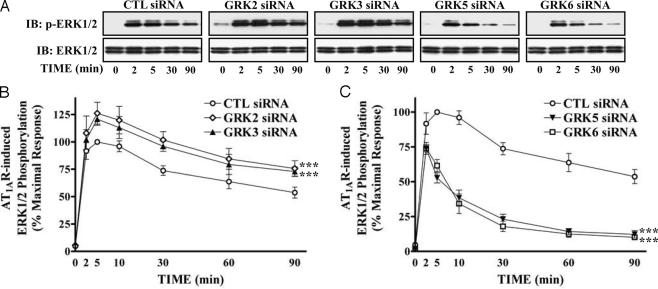
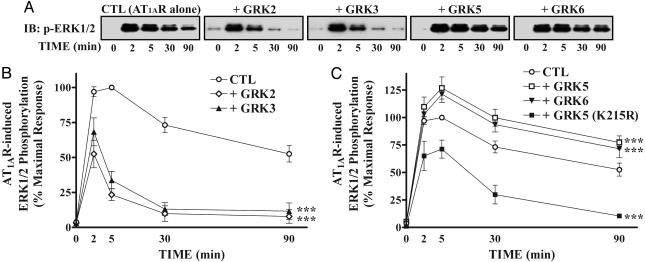
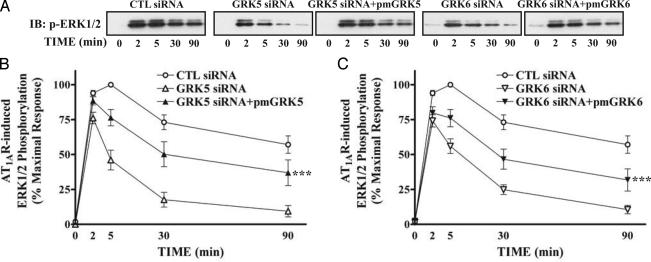
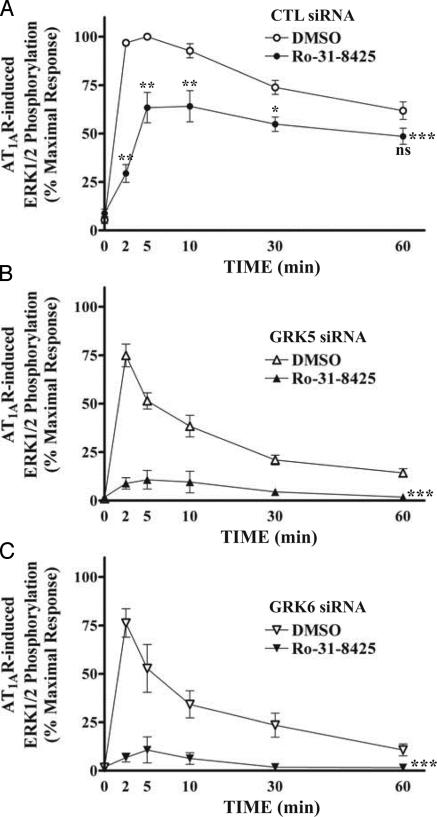
beta-arrestins bind to G protein-coupled receptor kinase (GRK)-phosphorylated seven transmembrane receptors, desensitizing their activation of G proteins, while concurrently mediating receptor endocytosis, and some aspects of receptor signaling. We have used RNA interference to assess the roles of the four widely expressed isoforms of GRKs (GRK 2, 3, 5, and 6) in regulating beta-arrestin-mediated signaling to the mitogen-activated protein kinase, extracellular signal-regulated kinase (ERK) 1/2 by the angiotensin II type 1A receptor. Angiotensin II-stimulated receptor phosphorylation, beta-arrestin recruitment, and receptor endocytosis are all mediated primarily by GRK2/3. In contrast, inhibiting GRK 5 or 6 expression abolishes beta-arrestin-mediated ERK activation, whereas lowering GRK 2 or 3 leads to an increase in this signaling. Consistent with these findings, beta-arrestin-mediated ERK activation is enhanced by overexpression of GRK 5 and 6, and reciprocally diminished by GRK 2 and 3. These findings indicate distinct functional capabilities of beta-arrestins bound to receptors phosphorylated by different classes of GRKs.


Figures

Fig. 1.
Fig. 1.
Analysis of GRK expression in siRNA-transfected HEK293 cells and its effects on AT1AR phosphorylation. (A) Cellular extracts were prepared from the indicated siRNA-transfected cells. Equal amounts of proteins in each sample were used to determine expression of each GRK by immunoblotting with specific anti-GRK antibodies. N/T, nontransfected. (B and C) Cells were transfected with the indicated siRNAs and plasmids encoding mutant AT1AR, in which PKC phosphorylation sites were substituted. After stimulation with 100 nM AngII for 3 min, receptor phosphorylation was visualized (B) and quantified (C) as described. Values shown are expressed as percent of the phosphorylation in stimulated, control (CTL) siRNA-transfected cells and represent the mean ± SE from three independent experiments. NS, nonstimulated. Statistical significance was determined by using a one-way ANOVA (PRISM software) to correct for multiple comparisons between each GRK siRNA-transfected and control cells (**, P < 0.01).
Fig. 2.
Fig. 2.
Effects of siRNA-mediated suppression of GRK levels on AngII-promoted β-arrestin recruitment to the receptor and AT1AR internalization. HEK293 cells were transfected with HA-AT1AR-encoding plasmids and the indicated siRNAs. (A and B) Serum-starved cells were exposed to 100 nM AngII for 2 min at 37°C, and β-arrestins (β-arrs) coimmunoprecipitated with the receptor were visualized (A) and quantified (B) as described. Values shown are expressed as percent of the level in stimulated, control (CTL) siRNA-transfected cells and represent the mean ± SE from three independent experiments. NS, nonstimulated. (C) Cells in serum-free media were cooled on ice and stimulated with 0.2 nM [125I]AngII for 5 min at 37°C. Percent of AngII-stimulated AT1AR internalization was determined as described. Data represent the mean ± SE from six independent experiments done in triplicate. Statistical significance was determined by using a one-way ANOVA or t test between each GRK siRNA-transfected and control cell (*, P < 0.05; **, P < 0.01; ***, P < 0.001 for ANOVA; +, P < 0.05 for t test).
Fig. 3.
Fig. 3.
Effects of siRNA-attenuated expression of different GRKs on the kinetic pattern of AT1AR-mediated ERK activation. siRNA-transfected cells were serum-starved and then stimulated with 100 nM AngII at 37°C for the indicated periods. Phosphorylation of ERK1/2 was visualized (A) and quantified (B and C) as described. (A Lower) Equal amounts of ERK1/2 were loaded in each sample. (B and C) Values in graphs are expressed as percent of the phosphorylation of ERK1/2 obtained at 5 min of stimulation in control (CTL) siRNA-transfected cells. Data represent the mean ± SE from at least five independent experiments. Statistical comparison of the curves was performed by using a two-way ANOVA between GRK siRNA-transfected and control cells (***, P < 0.001).
Fig. 4.
Fig. 4.
Effects of GRK overexpression on the kinetic pattern of ERK activation after stimulation of AT1AR. (A) HEK293 cells were transiently transfected with HA-AT1AR-encoding plasmids and the indicated GRK-encoding plasmids. After serum-starvation and stimulation, phosphorylation of ERK1/2 was visualized (A) and quantified (B and C) as described in Fig. 3. (B and C) Each data point is expressed as percent of the phosphorylation of ERK1/2 obtained at 5 min of stimulation in control (CTL) cells and represents the mean ± SE from at least three independent experiments. Statistical comparison of the curves was performed by using a two-way ANOVA between GRK siRNA-transfected and control cells (***, P < 0.001).
Fig. 5.
Fig. 5.
Rescue of GRK 5 and 6 siRNA-mediated effects on the kinetic pattern of AngII-induced ERK activation. Cells were transfected with HA-AT1AR-encoding plasmids, each indicated siRNA, and either pRK5 empty vector or plasmids expressing indicated wobble mutants of GRK (pmGRK) simultaneously. After serum starvation and stimulation, phosphorylation of ERK1/2 was visualized (A) and quantified (B and C) as described in Fig. 3. (B and C) Values in graphs are expressed as percentage of the phosphorylation of ERK1/2 obtained at 5 min of stimulation in control (CTL) siRNA-transfected cells and represent the mean ± SE from seven independent experiments. Statistical comparison of the curves was performed by using a two-way ANOVA between GRK siRNA with and without pmGRK-transfected cells in each graph (***, P < 0.001).
Fig. 6.
Fig. 6.
Effects of the PKC inhibitor Ro-31-8425 on the kinetic pattern of AT1AR-mediated ERK activation. siRNA-transfected cells were serum-starved and then treated with vehicle only (DMSO) or 1 μM Ro-31-8425 for 15 min before stimulation. Phosphorylation of ERK1/2 was determined as described in Fig. 3. Data in each graph are expressed as percent of the phosphorylation of ERK1/2 obtained at 5 min of stimulation in control (CTL) siRNA-transfected, DMSO-treated cells and represent the mean ± SE from at least five independent experiments. Statistical comparison of the curves (***, P < 0.001) and values at each time point (A; ns, nonsignificant; *, P < 0.05; **, P < 0.01) were performed by using a two-way ANOVA between DMSO- and Ro-31-8425-treated cells.

Similar articles

Cited by

References

    1. Pierce, K. L., Premont, R. T. & Lefkowitz, R. J. (2002) Nat. Rev. Mol. Cell. Biol. 3, 639-650. - PubMed
    1. Lefkowitz, R. J. (1998) J. Biol. Chem. 273, 18677-18680. - PubMed
    1. Kohout, T. A. & Lefkowitz, R. J. (2003) Mol. Pharmacol. 63, 9-18. - PubMed
    1. Goodman, O. B., Jr., Krupnick, J. G., Santini, F., Gurevich, V. V., Penn, R. B., Gagnon, A. W., Keen, J. H. & Benovic, J. L. (1996) Nature 383, 447-450. - PubMed
    1. Laporte, S. A., Oakley, R. H., Zhang, J., Holt, J. A., Ferguson, S. S., Caron, M. G. & Barak, L. S. (1999) Proc. Natl. Acad. Sci. USA 96, 3712-3717. - PMC - PubMed

Publication types

MeSH terms

Substances

LinkOut - more resources