

Comparative geographic concentrations of 4 sexually transmitted infections
- PMID: 15671471
- PMCID: PMC1449173
- DOI: 10.2105/AJPH.2003.029413
Comparative geographic concentrations of 4 sexually transmitted infections
Abstract
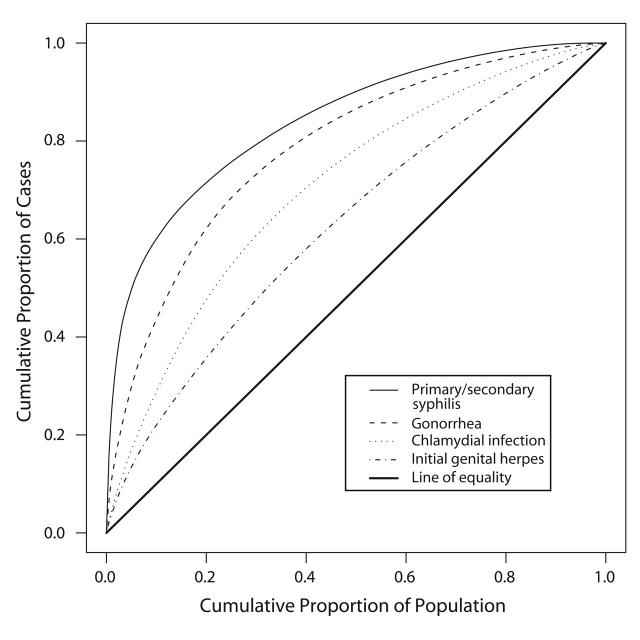
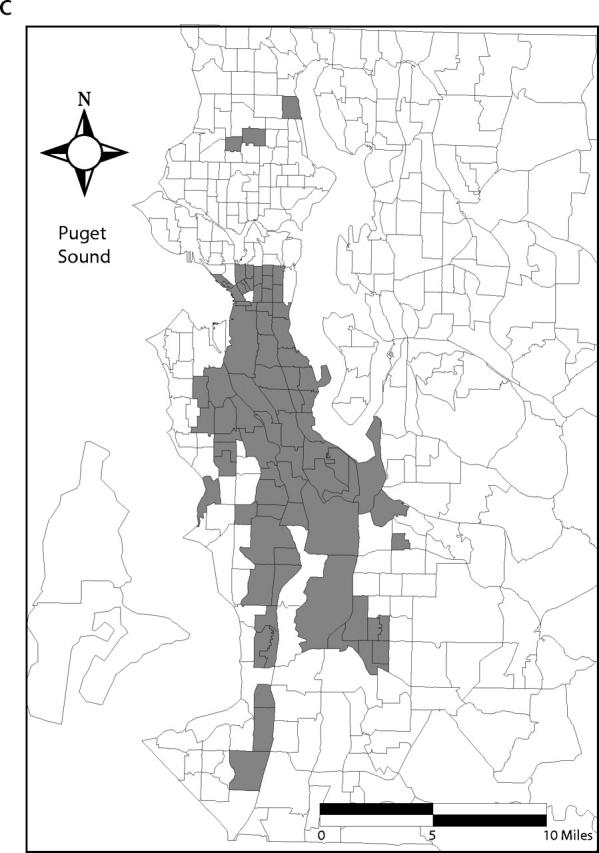
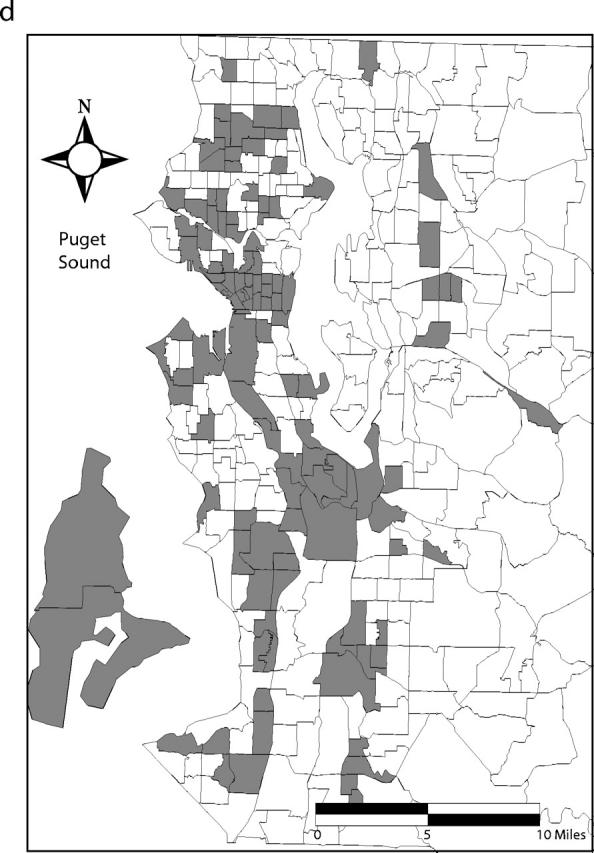
Objectives: We measured and compared the concentration of primary and secondary syphilis, gonorrhea, chlamydial infection, and genital herpes in a large county with urban, suburban, and rural settings.
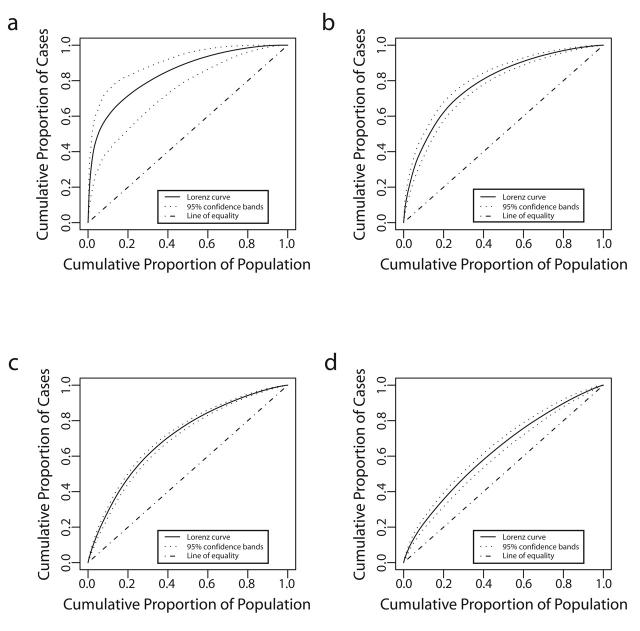
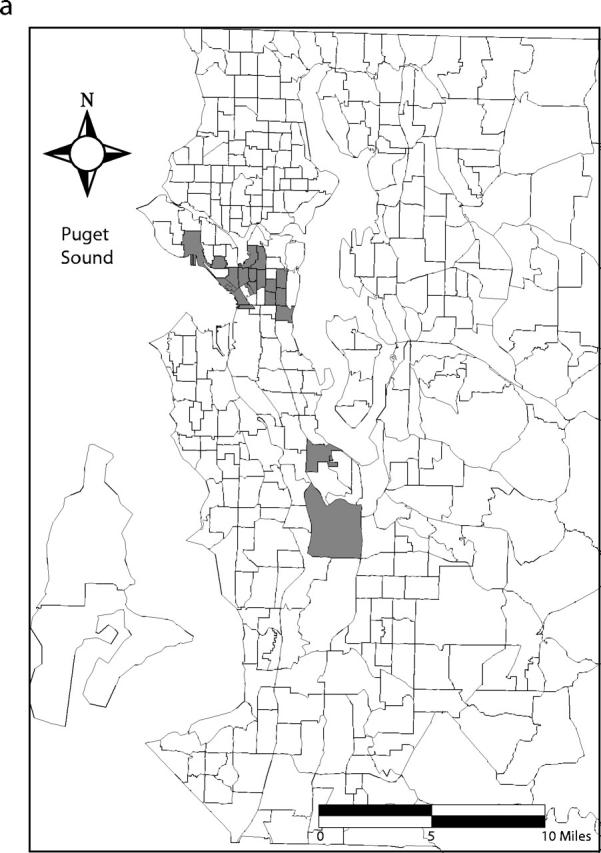
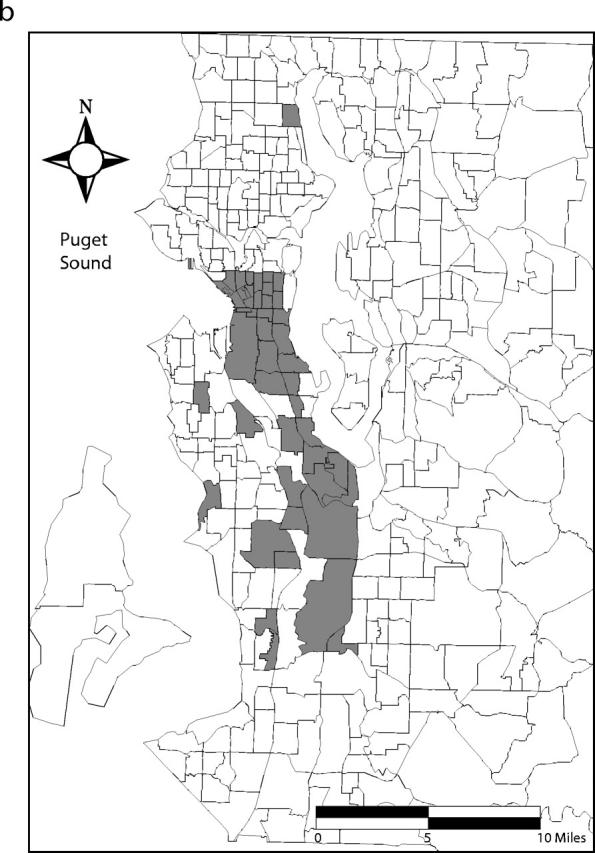
Methods: We geocoded sexually transmitted infections reported to King County, Washington health department in 2000-2001 to census tract of residence. We used a model-based approach to measure concentration with Lorenz curves and Gini coefficients.
Results: Syphilis exhibited the highest level of concentration (estimated Gini coefficient = 0.68, 95% confidence interval [CI] = 0.64, 0.78), followed by gonorrhea (estimated Gini coefficient=0.57; 95% CI=0.54, 0.60), chlamydial infection (estimated Gini coefficient = 0.45; 95% CI = 0.40, 0.43), and herpes (estimated Gini coefficient=0.26; 95% CI=0.22, 0.29).
Conclusions: Geographically targeted interventions may be most appropriate for syphilis and gonorrhea. For less-concentrated infections, control strategies must reach a wider portion of the population.
Figures
Similar articles
-
Increasing incidence rates of sexually transmitted infections from 2010 to 2019: an analysis of temporal trends by geographical regions and age groups from the 2019 Global Burden of Disease Study.BMC Infect Dis. 2022 Jun 26;22(1):574. doi: 10.1186/s12879-022-07544-7. BMC Infect Dis. 2022. PMID: 35754034 Free PMC article.
-
Changing Demography of Genital Chlamydia, Gonorrhea, Genital Herpes, Condyloma, and Syphilis Infections in Japan.Jpn J Infect Dis. 2021 Jan 22;74(1):35-41. doi: 10.7883/yoken.JJID.2020.005. Epub 2020 Jun 30. Jpn J Infect Dis. 2021. PMID: 32611973
-
Current views on sexually transmitted diseases.Ann Clin Res. 1985;17(2):43-4. Ann Clin Res. 1985. PMID: 3839992 No abstract available.
-
[Epidemiology of sexually transmissible diseases in Europe].Acta Urol Belg. 1993 Jan-Jun;61(1-2):61-9. Acta Urol Belg. 1993. PMID: 8390788 Review. French. No abstract available.
-
Sexually transmitted diseases.Indiana Med. 1984 Nov;77(11):857-62. Indiana Med. 1984. PMID: 6392415 Review. No abstract available.
Cited by
-
COVID-19 Cases Among Congregate Care Facility Staff by Neighborhood of Residence and Social and Structural Determinants: Observational Study.JMIR Public Health Surveill. 2022 Oct 4;8(10):e34927. doi: 10.2196/34927. JMIR Public Health Surveill. 2022. PMID: 35867901 Free PMC article.
-
Incorporating geospatial capacity within clinical data systems to address social determinants of health.Public Health Rep. 2011 Sep-Oct;126 Suppl 3(Suppl 3):54-61. doi: 10.1177/00333549111260S310. Public Health Rep. 2011. PMID: 21836738 Free PMC article.
-
Impact of public housing relocations: are changes in neighborhood conditions related to STIs among relocaters?Sex Transm Dis. 2014 Oct;41(10):573-9. doi: 10.1097/OLQ.0000000000000172. Sex Transm Dis. 2014. PMID: 25211249 Free PMC article.
-
Enhancing insights in sexually transmitted infection mapping: Syphilis in Forsyth County, North Carolina, a case study.PLoS Comput Biol. 2024 Oct 31;20(10):e1012464. doi: 10.1371/journal.pcbi.1012464. eCollection 2024 Oct. PLoS Comput Biol. 2024. PMID: 39480897 Free PMC article.
-
Newborns With Neonatal Abstinence Syndrome Are Concentrated in Poorer-Quality Hospitals.Hosp Pediatr. 2021 Apr;11(4):342-349. doi: 10.1542/hpeds.2020-003145. Epub 2021 Mar 18. Hosp Pediatr. 2021. PMID: 33737332 Free PMC article.
References
-
- Wasserheit J, Aral S. The dynamic topology of sexually transmitted disease epidemics: implications for prevention strategies. J Infect Dis. 1996;174(suppl 2): S201–S213. - PubMed
-
- Wasserheit J. STD control strategies: a synthetic overview. Paper presented at: Phase-Specific Strategies for Prevention, Control and Elimination of Sexually Transmitted Diseases: Implications for Research, Policies and Programs; October 3–6, 2000; Rome, Italy. Cosponsored by the Centers for Disease Control and Prevention, the European Commission, the Wellcome Trust, and Health Canada.
-
- US Census Bureau. Available at: http://www.census.gov/main/www/cen2000.html. Accessed November 7, 2004.
Publication types
MeSH terms
Grants and funding
LinkOut - more resources
Full Text Sources
Medical
