

Regulation of alpha-synuclein expression by poly (ADP ribose) polymerase-1 (PARP-1) binding to the NACP-Rep1 polymorphic site upstream of the SNCA gene
- PMID: 15672325
- PMCID: PMC1196399
- DOI: 10.1086/428655
Regulation of alpha-synuclein expression by poly (ADP ribose) polymerase-1 (PARP-1) binding to the NACP-Rep1 polymorphic site upstream of the SNCA gene
Abstract
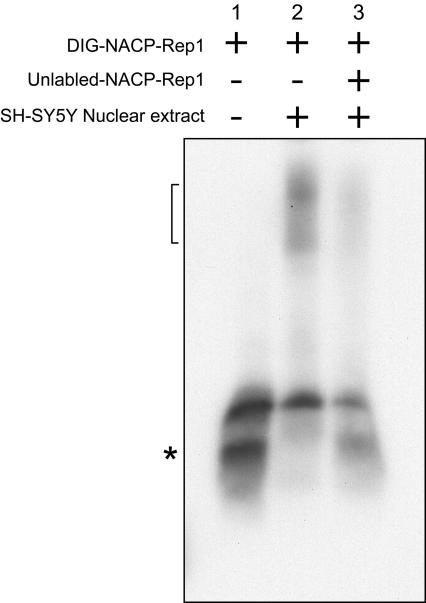
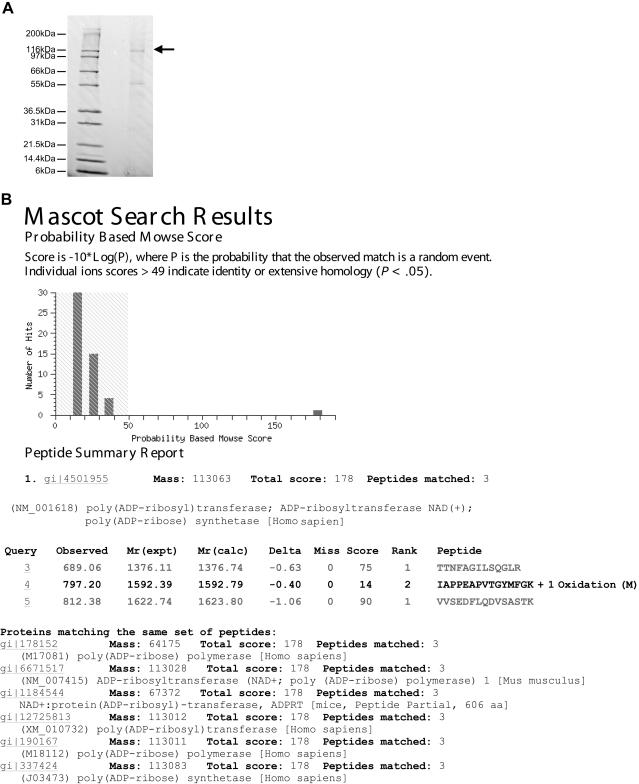
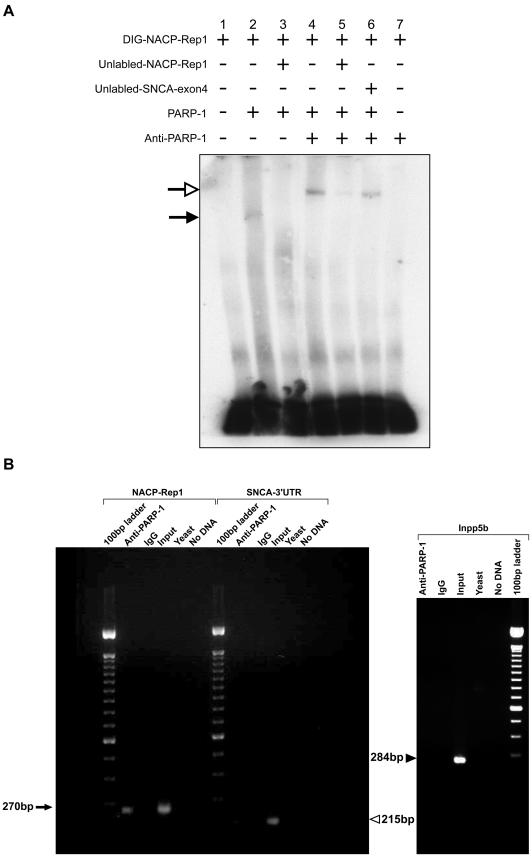
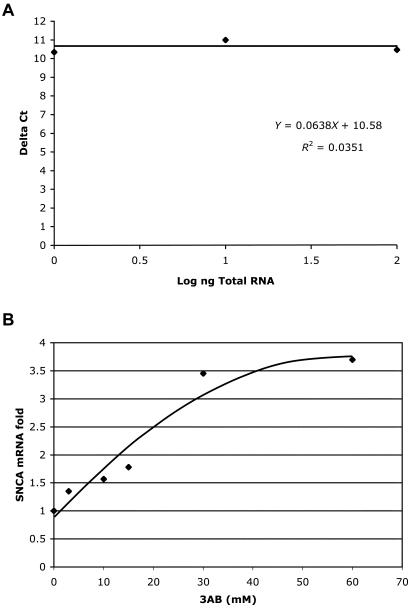
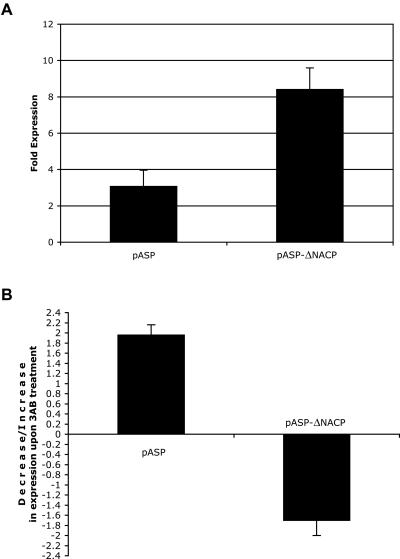
Alleles at NACP-Rep1, the polymorphic microsatellite repeat located approximately 10 kb upstream of the alpha -synuclein gene (SNCA), are associated, in some reports, with differing risks of sporadic Parkinson disease (PD). We showed previously that NACP-Rep1 acts as a negative modulator of SNCA transcription, with an effect that varied threefold among different NACP-Rep1 alleles. Given that duplications and triplications of SNCA have been implicated in familial Parkinson disease (PD), even a 1.5-2-fold increase in alpha -synuclein expression may, over many decades, contribute to PD. Thus, the association of different NACP-Rep1 alleles with PD may be a consequence of polymorphic differences in transcriptional regulation of SNCA. Here we aimed to identify the factor(s) that bind to NACP-Rep1 and potentially contribute to SNCA transcriptional modulation, by pulling down proteins that bind to NACP-Rep1 and identifying them by mass spectrometry. One of these proteins was poly-(ADP-ribose) transferase/polymerase-1 (PARP-1), a DNA-binding protein and transcriptional regulator. Electrophoresis mobility shift and chromatin immunoprecipitation assays showed specific binding of PARP-1 to NACP-Rep1. Inhibition of PARP-1's catalytic domain increased the endogenous SNCA mRNA levels in cultured SH-SY5Y cells. Furthermore, PARP-1 binding to NACP-Rep1 specifically reduced the transcriptional activity of the SNCA promoter/enhancer in luciferase reporter assays. This down-regulation effect of PARP-1 depended on NACP-Rep1 being present in the construct and was abrogated by inhibiting PARP-1's catalytic activity with 3-aminobenzamide. The association of different NACP-Rep1 alleles with PD may be mediated, in part, by the effect of PARP-1, as well as other factors, on SNCA expression.
Figures
Similar articles
-
Effect of allelic variation at the NACP-Rep1 repeat upstream of the alpha-synuclein gene (SNCA) on transcription in a cell culture luciferase reporter system.Hum Mol Genet. 2001 Dec 15;10(26):3101-9. doi: 10.1093/hmg/10.26.3101. Hum Mol Genet. 2001. PMID: 11751692
-
Functional analysis of intra-allelic variation at NACP-Rep1 in the alpha-synuclein gene.Hum Genet. 2003 Oct;113(5):426-31. doi: 10.1007/s00439-003-1002-9. Epub 2003 Aug 16. Hum Genet. 2003. PMID: 12923682
-
Expansion of the Parkinson disease-associated SNCA-Rep1 allele upregulates human alpha-synuclein in transgenic mouse brain.Hum Mol Genet. 2009 Sep 1;18(17):3274-85. doi: 10.1093/hmg/ddp265. Epub 2009 Jun 4. Hum Mol Genet. 2009. PMID: 19498036 Free PMC article.
-
SNCA REP1 and Parkinson's disease.Neurosci Lett. 2018 Aug 24;682:79-84. doi: 10.1016/j.neulet.2018.05.043. Epub 2018 May 30. Neurosci Lett. 2018. PMID: 29859327 Review.
-
Gene dosage and pathogenesis of Parkinson's disease.Trends Mol Med. 2005 Mar;11(3):91-6. doi: 10.1016/j.molmed.2005.01.001. Trends Mol Med. 2005. PMID: 15760766 Review.
Cited by
-
Interpreting Gene Expression Effects of Disease-Associated Variants: A Lesson from SNCA rs356168.Front Genet. 2017 Sep 20;8:133. doi: 10.3389/fgene.2017.00133. eCollection 2017. Front Genet. 2017. PMID: 28979294 Free PMC article.
-
Regulation of Αlpha-Synuclein Gene (SNCA) by Epigenetic Modifier TET1 in Parkinson Disease.Int Neurourol J. 2022 Nov;26(Suppl 2):S85-93. doi: 10.5213/inj.2222206.103. Epub 2022 Nov 30. Int Neurourol J. 2022. PMID: 36503211 Free PMC article.
-
Positive transcriptional regulation of the human micro opioid receptor gene by poly(ADP-ribose) polymerase-1 and increase of its DNA binding affinity based on polymorphism of G-172 -> T.J Biol Chem. 2009 Jul 24;284(30):20175-83. doi: 10.1074/jbc.M109.019414. Epub 2009 May 15. J Biol Chem. 2009. PMID: 19447888 Free PMC article.
-
Aggregates assembled from overexpression of wild-type alpha-synuclein are not toxic to human neuronal cells.J Neuropathol Exp Neurol. 2008 Nov;67(11):1084-96. doi: 10.1097/NEN.0b013e31818c3618. J Neuropathol Exp Neurol. 2008. PMID: 18957893 Free PMC article.
-
Association analysis of PARP1 polymorphisms with Parkinson's disease.Parkinsonism Relat Disord. 2011 Nov;17(9):701-4. doi: 10.1016/j.parkreldis.2011.06.022. Epub 2011 Jul 20. Parkinsonism Relat Disord. 2011. PMID: 21767974 Free PMC article.
References
Electronic-Database Information
-
- Online Mendelian Inheritance in Man (OMIM), http://www.ncbi.nlm.nih.gov/Omim/ (for PD and SNCA) - PubMed
References
-
- Chartier-Harlin MC, Kachergus J, Roumier C, Mouroux V, Douay X, Lincoln S, Levecque C, Larvor L, Andrieux J, Hulihan M, Waucquier N, Defebvre L, Amouyel P, Farrer M, Destee A (2004) Alpha-synuclein locus duplication as a cause of familial Parkinson’s disease. Lancet 364:1167–116910.1016/S0140-6736(04)17103-1 - DOI - PubMed
Publication types
MeSH terms
Substances
Associated data
- Actions
- Actions
Grants and funding
LinkOut - more resources
Full Text Sources
Other Literature Sources
Miscellaneous
