

Two ribeye genes in teleosts: the role of Ribeye in ribbon formation and bipolar cell development
- PMID: 15673675
- PMCID: PMC6725632
- DOI: 10.1523/JNEUROSCI.4657-04.2005
Two ribeye genes in teleosts: the role of Ribeye in ribbon formation and bipolar cell development
Abstract
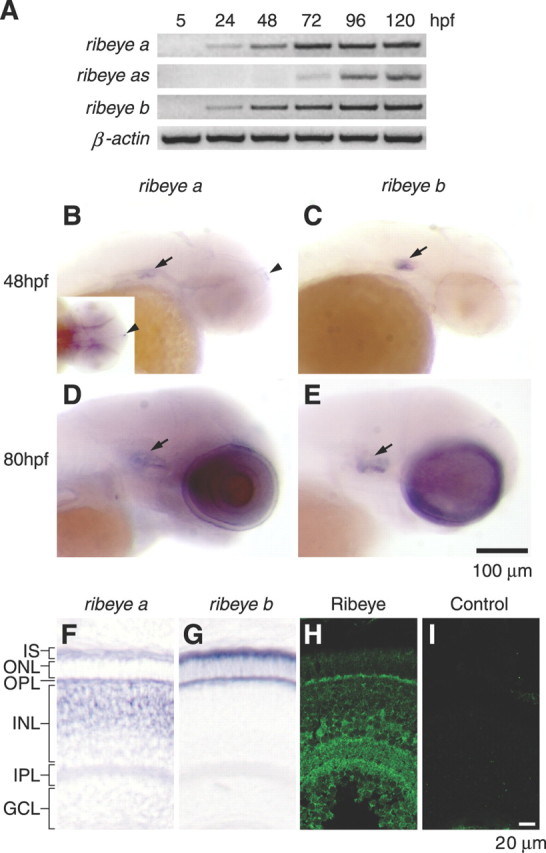
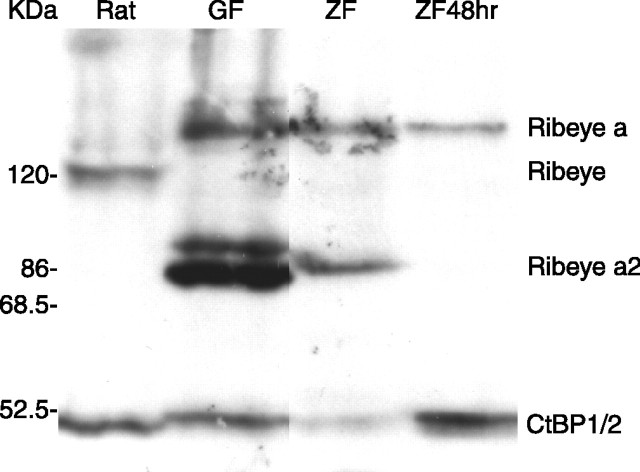
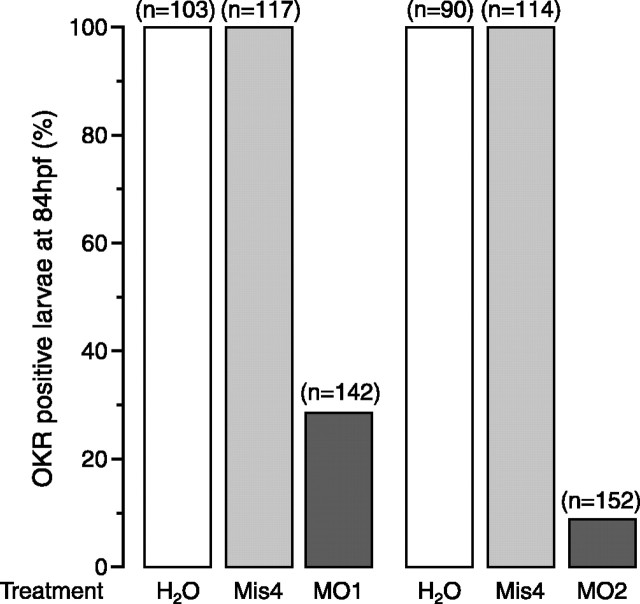
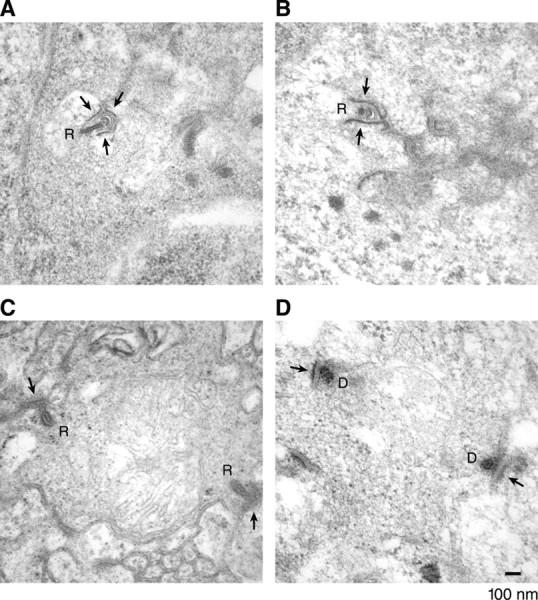
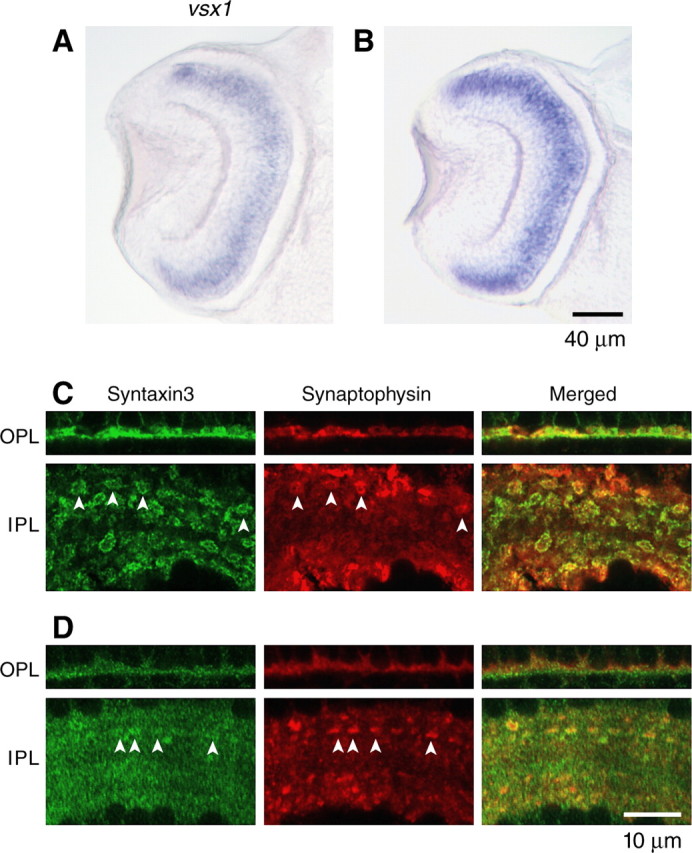
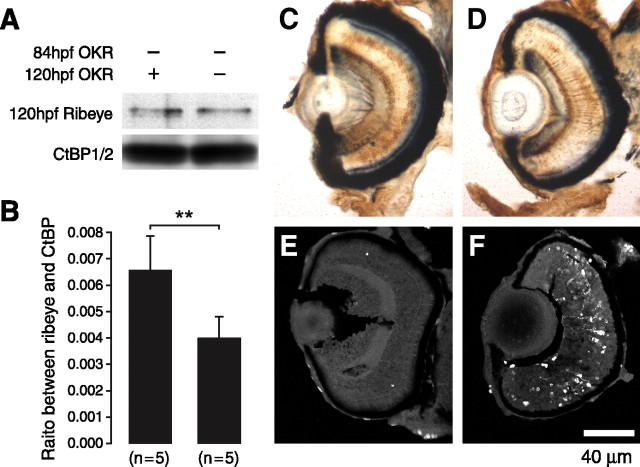
Ribeye is the only known protein specific to synaptic ribbon, but its function is unclear. We show that the teleost fish, Fugu and zebrafish, have two ribeye genes, ribeye a and ribeye b. Whole-mount in situ hybridization revealed that ribeye a is expressed in tissues containing synaptic ribbons, including the pineal gland, inner ear, and retina. Ribeye b is absent in the pineal gland. In the retina, ribeye a is expressed in both photoreceptors and bipolar cells, whereas ribeye b is detected only in photoreceptors. To study the function of Ribeye a in retina, we depleted it by morpholino antisense oligos. Fish deficient in Ribeye a lack an optokinetic response and have shorter synaptic ribbons in photoreceptors and fewer synaptic ribbons in bipolar cells. Their bipolar cells still target Syntaxin-3 proteins to the inner plexiform layer and have abundant vsx1 mRNA. However, they lack large synaptic terminals and show increased apoptosis. Rod bipolar cells are fewer in number and/or deficient in PKCalpha. Recovery of Ribeye a levels rescues the optokinetic response, increases the number of PKCalpha-positive bipolar cells, and stops apoptosis. We conclude that Ribeye a is important for late steps in bipolar cell development.
Figures

Similar articles
-
Characterization of Ribeye subunits in zebrafish hair cells reveals that exogenous Ribeye B-domain and CtBP1 localize to the basal ends of synaptic ribbons.PLoS One. 2014 Sep 10;9(9):e107256. doi: 10.1371/journal.pone.0107256. eCollection 2014. PLoS One. 2014. PMID: 25208216 Free PMC article.
-
High-resolution optical imaging of zebrafish larval ribbon synapse protein RIBEYE, RIM2, and CaV 1.4 by stimulation emission depletion microscopy.Microsc Microanal. 2012 Aug;18(4):745-52. doi: 10.1017/S1431927612000268. Epub 2012 Jul 26. Microsc Microanal. 2012. PMID: 22832038 Free PMC article.
-
How to make a synaptic ribbon: RIBEYE deletion abolishes ribbons in retinal synapses and disrupts neurotransmitter release.EMBO J. 2016 May 17;35(10):1098-114. doi: 10.15252/embj.201592701. Epub 2016 Feb 29. EMBO J. 2016. PMID: 26929012 Free PMC article.
-
The making of synaptic ribbons: how they are built and what they do.Neuroscientist. 2009 Dec;15(6):611-24. doi: 10.1177/1073858409340253. Neuroscientist. 2009. PMID: 19700740 Review.
-
Dual use of the transcriptional repressor (CtBP2)/ribbon synapse (RIBEYE) gene: how prevalent are multifunctional genes?Trends Neurosci. 2001 Oct;24(10):555-7. doi: 10.1016/s0166-2236(00)01894-4. Trends Neurosci. 2001. PMID: 11576649 Review.
Cited by
-
Role of Ribeye PXDLS/T-binding cleft in normal synaptic ribbon function.bioRxiv [Preprint]. 2023 Dec 12:2023.12.12.571266. doi: 10.1101/2023.12.12.571266. bioRxiv. 2023. PMID: 38168344 Free PMC article. Preprint.
-
Diurnal changes in exocytosis and the number of synaptic ribbons at active zones of an ON-type bipolar cell terminal.J Neurophysiol. 2006 Oct;96(4):2025-33. doi: 10.1152/jn.00364.2006. Epub 2006 May 31. J Neurophysiol. 2006. PMID: 16738212 Free PMC article.
-
What drives cell morphogenesis: a look inside the vertebrate photoreceptor.Dev Dyn. 2009 Sep;238(9):2115-38. doi: 10.1002/dvdy.22010. Dev Dyn. 2009. PMID: 19582864 Free PMC article. Review.
-
Enrichment and differential targeting of complexins 3 and 4 in ribbon-containing sensory neurons during zebrafish development.Neural Dev. 2010 Sep 1;5:24. doi: 10.1186/1749-8104-5-24. Neural Dev. 2010. PMID: 20809954 Free PMC article.
-
Identification of molecular markers of bipolar cells in the murine retina.J Comp Neurol. 2008 Apr 10;507(5):1795-810. doi: 10.1002/cne.21639. J Comp Neurol. 2008. PMID: 18260140 Free PMC article.
References
-
- Amores A, Force A, Yan YL, Joly L, Amemiya C, Fritz A, Ho RK, Langeland J, Prince V, Wang YL, Westerfield M, Ekker M, Postlethwait JH (1998) Zebrafish hox clusters and vertebrate genome evolution. Science 282: 1711-1714. - PubMed
-
- Bilotta J, Saszik S (2001) The zebrafish as a model visual system. Int J Dev Neurosci 19: 621-629. - PubMed
Publication types
MeSH terms
Substances
Grants and funding
LinkOut - more resources
Full Text Sources
Molecular Biology Databases