. 2005 Jan 26;33(2):525-35.
doi: 10.1093/nar/gki178. Print 2005.

In vitro synthesis of uniform poly(dG)-poly(dC) by Klenow exo- fragment of polymerase I

Affiliations

In vitro synthesis of uniform poly(dG)-poly(dC) by Klenow exo- fragment of polymerase I

Alexander B Kotlyar et al. Nucleic Acids Res. .

Abstract

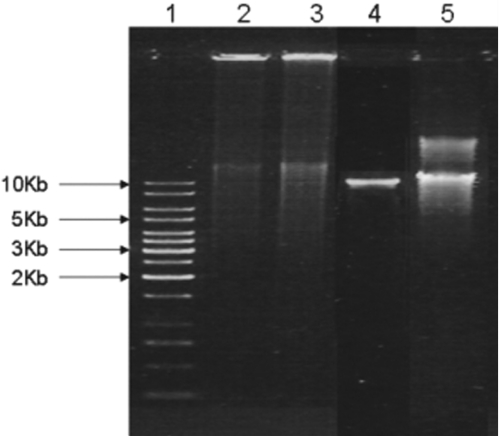
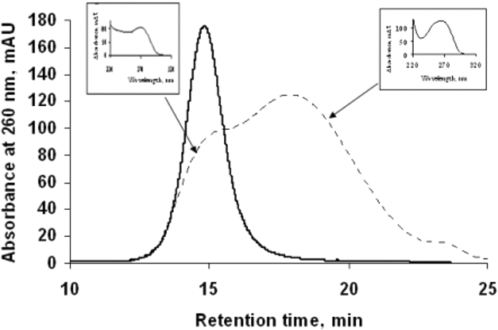
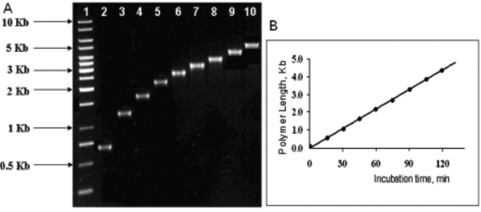
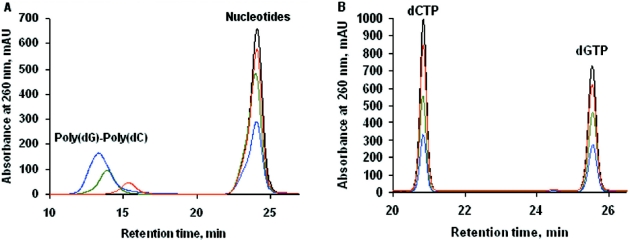
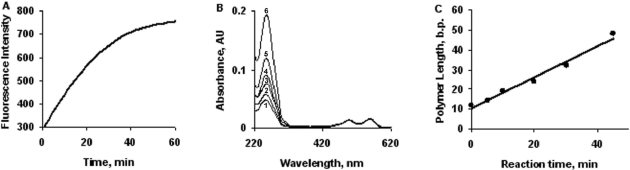
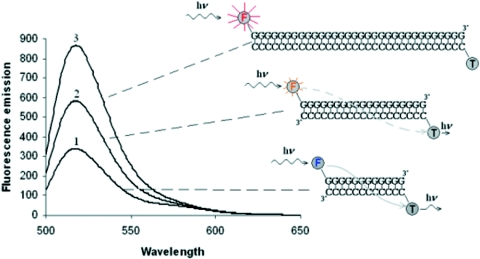
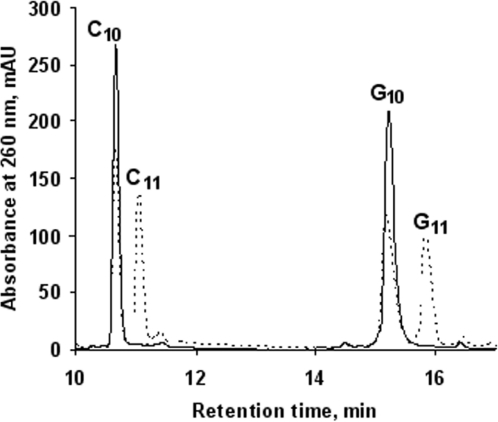
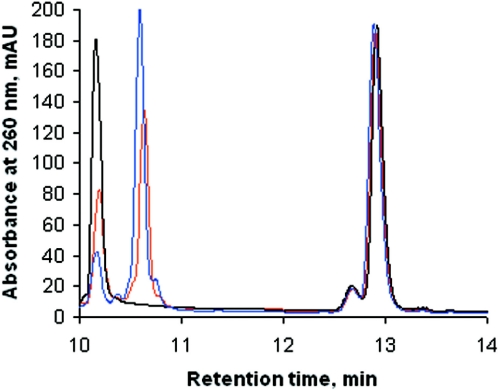
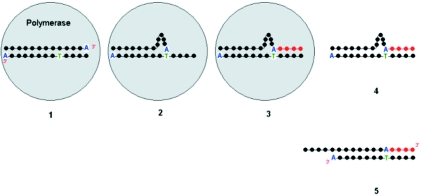
In this paper, we describe a production procedure of the one-to-one double helical complex of poly(dG)-poly(dC), characterized by a well-defined length (up to 10 kb) and narrow size distribution of molecules. Direct evidence of strands slippage during poly(dG)-poly(dC) synthesis by Klenow exo(-) fragment of polymerase I is obtained by fluorescence resonance energy transfer (FRET). We show that the polymer extension results in an increase in the separation distance between fluorescent dyes attached to 5' ends of the strands in time and, as a result, losing communication between the dyes via FRET. Analysis of the products of the early steps of the synthesis by high-performance liquid chromatography and mass spectroscopy suggest that only one nucleotide is added to each of the strand composing poly(dG)-poly(dC) in the elementary step of the polymer extension. We show that proper pairing of a base at the 3' end of the primer strand with a base in sequence of the template strand is required for initiation of the synthesis. If the 3' end nucleotide in either poly(dG) or poly(dC) strand is substituted for A, the polymer does not grow. Introduction of the T-nucleotide into the complementary strand to permit pairing with A-nucleotide results in the restoration of the synthesis. The data reported here correspond with a slippage model of replication, which includes the formation of loops on the 3' ends of both strands composing poly(dG)-poly(dC) and their migration over long-molecular distances (microm) to 5' ends of the strands.


Figures

Figure 1
Figure 1
Mobility of poly(dG)–poly(dC) molecules in 1% agarose gel. Electrophoresis of the molecules: molecular weights of 1 kb DNA-ladder (lane 1) are indicated by left-hand side narrows; poly(dG)–poly(dC) from Sigma, lot 103K10561 (lane 2); poly(dG)–poly(dC) from Sigma treated for 30 min at 70°C (lane 3); poly(dG)–poly(dC) synthesized as described in Materials and Methods using HPLC-purified 0.2 μM (dG)10–(dC)10 as template-primer and 40 μg/ml of Klenow exo (lane 4); poly(dG)–poly(dC) synthesized as described in Materials and Methods using 0.2 μM (dG)10–(dC)10 not specially purified by HPLC as template-primer and 40 μg/ml of Klenow exo (lane 5). The electrophoresis was conducted for 1 h at 130 V. The amount of DNA loaded per lane was ∼20 ng and the gel was ethidium bromide stained.
Figure 2
Figure 2
Size-dependent HPLC of poly(dG)–poly(dC) at high-pH. Poly(dG)–poly(dC) synthesized with Klenow exo as described in Figure 1 (solid curve) and poly(dG)–poly(dC) from Sigma (dashed curve) were pretreated for 15 min at room temperature in 0.1 M KOH. A total of 100 μl of each DNA sample were applied onto TSKgel G-DNA-PW column (7.8 × 300 mm) and eluted at room temperature with 0.1 M KOH at a flow rate of 0.5 ml/min. The length of the synthesized poly(dG)–poly(dC) estimated by gel electrophoresis as shown in Figure 1 is equal to 7 kb. Elution was followed at 260 nm. Insets present normalized absorbance spectra obtained using diode-array detection of fractions eluted at the time points indicated by the arrows.
Figure 3
Figure 3
Time course of poly(dG)–poly(dC) synthesis reaction. Polymerase extension assay was performed as described in Materials and Methods with 0.2 μM (dG)10–(dC)10 and 20 μg/ml of Klenow exo; the incubation was at 37°C. Aliquots were withdrawn each 15 min for 2 h 15 min. (A) The reaction products were resolved on 1% agarose gel and stained with ethidium bromide under conditions described in Materials and Methods. The marker bands of 1 kb DNA ladder (lane 1) are indicated to the left. Time-dependent products for 15, 30, 45, 60, 75, 90, 105, 120 and 135 min of the synthesis (lanes 2–10). (B) Dependence of the polymer length (in kb) estimated from (A) on the time of synthesis.
Figure 4
Figure 4
HPLC analysis of nucleotides incorporation into poly(dG)–poly(dC). (A) Size-dependent HPLC separation of the products of polymerase synthesis. Polymerase extension assay was performed as described in Materials and Methods with 0.2 μM (dG)10–(dC)10 and 20 μg/ml of Klenow exo at 37°C. Polymerization reaction was started by addition of the enzyme. Aliquots of 50 μl were withdrawn from the assay mixture before (black curve) and 30 (red curve), 60 (green curve) and 120 (blue curve) min after the addition of the enzyme and loaded on TSKgel G-DNA-PW column (7.8 × 300 mm). Elution was performed with 20 mM Tris–Acetate buffer, pH 7.0, at a flow rate of 0.5 ml/min. (B) Anion-exchange HPLC separation of nucleotides. Nucleotide peaks from corresponding size-exclusion separation (A) were collected and loaded on an anion-exchange PolyWax LP column (4.6 × 200 mm). Elution was performed using a 30 min linear K-Pi, pH 7.4, gradient between 0.02 and 0.5 M in the presence of 10% acetonitrile at a flow rate of 0.8 ml/min. Elution was followed at 260 nm.
Figure 5
Figure 5
FRET in Flu-(dG)12–(dC)12-TAMRA during extension by Klenow exo. (A) Time course of Flu emission. Polymerase extension assay was performed as described in Materials and Methods with 5 μM Flu-(dG)12–(dC)12-TAMRA and 0.8 μg/ml of Klenow exo. The assay mixture containing Flu-(dG)12–(dC)12-TAMRA and nucleotides was transferred into a fluorimetric cuvette. Fluorescence emission at 520 nm was recorded in time as described in Materials and Methods; excitation was at 490 nm. A significant amount of energy transfer is detected as a large decrease in the contribution of the Flu donor and an increase in the contribution of the TAMRA acceptor. The extension reaction was started by addition of the enzyme and fluorescence was recorded in time. (B) Aliquots of 0.5 ml of sample was withdrawn from the incubation before (curve 1) and 5 (curve 2), 10 (curve 3), 20 (curve 4), 30 (curve 5), and 40 (curve 6) min after addition of the enzyme to the assay. The samples were passed through Sephadex G-25 DNA-Grade column (1 × 5 cm) in 20 mM Tris–Acetate buffer, pH 8.0, to separate high-molecular weight products of the synthesis from nucleotides; absorption spectra of the synthesized polymer eluted in the column's void volume were recorded. (C) The amount of G–C base pairs in double-labeled product of the synthesis were estimated from analysis of the spectra presented in (B) as described in Materials and Method, and plotted as a function of time of synthesis.
Figure 6
Figure 6
Fluorescence emission spectra of the products of Flu-(dC)12–(dG)12-TAMRA extension. Polymerase extension assay was performed as described in Figure 5. The spectra were recorded before (curve 1), and 10 (curve 2) and 25 (curve 3) min after initiation of the synthesis. Excitation was at 490 nm. Schematic presentation of corresponding double-stranded products of the synthesis, are indicated to the right; F denotes for Flu, T for TAMRA. A significant amount of energy transfer in Flu-(dC)12–(dG)12-TAMRA is apparent as a decrease in the contribution of the Flu donor and an increase in the contribution of the TAMRA acceptor. The latter is seen as an increased relative emission around 580 nm in spectra of Flu-(dC)12–(dG)12-TAMRA. Extension of Flu-(dC)12–(dG)12-TAMRA results in an increase of molecular distance between the dyes and, as a result, in increase of Flu emission. When the length of extended polymer reaches ∼20 bp (see Figure 5), a reduced amount of energy transfer is apparent (spectrum 2). Flu emission reaches maximum, when the length of extended polymer is equal to ∼30 bp (∼10 nm); no contribution of TAMRA emission is then seen.
Figure 7
Figure 7
HPLC analysis of products of early phase of poly(dG)–poly(dC) synthesis. Polymerase extension assay was performed as described in Materials and Methods, with 15 μM (dG)10–(dC) 10 and 2 μg/ml of Klenow exo at 37°C. The reaction was started by addition of the enzyme and was terminated by addition of 10 mM EDTA. Aliquots of 50 μl were withdrawn from the assay mixture before (continuous curve) and 5 min (dashed curve) after the reaction had been started. Oligonucleotides were separated from dGTP and dCTP with TSKgel G-3000 SWXL HPLC column (7.8 × 300 mm) and loaded in 0.1 M KOH onto TSKgel DNA-NPR column (4.6 × 75 mm) equilibrated with 0.1 M KOH. Elution was performed using a 30 min linear KCl gradient between 0 and 1 M in 0.1 M KOH at a flow rate of 0.6 ml/min. Elution of correspondent C- and G-strands are indicated in the figure.
Figure 8
Figure 8
HPLC analysis of products of 5′-CCCCCCCCCCCCA-3′–5′-GGGGTGGGGGGGA-3′ extension. Polymerase extension assay was performed as described in Materials and Methods with 5 μM 5′-CCCCCCCCCCCCA-3′–5′-GGGGTGGGGGGGA-3′ and 10 μg/ml of Klenow exo at 37°C. The reaction was started by addition of the enzyme and terminated by addition of 10 mM EDTA. Aliquots of 50 μl of sample were withdrawn from the assay mixture before (black curve) and 10 (red curve), and 20 (blue curve) min after the reaction had been started. Oligomers were separated from dGTP and dCTP with TSKgel G-3000 SWXL HPLC column (7.8 × 300 mm) and loaded in 0.1 M KOH onto TSKgel DNA-NPR column (4.6 × 75 mm). Elution was performed using a 20 min linear gradient between 0 and 1 M KCl in 0.1 M KOH at a flow rate of 0.6 ml/min.
Figure 9
Figure 9
Model for 5′-CCCCCCCCCCCCA-3′–5′-GGGGTGGGGGGGA-3′ extension. The figure depicts the assumed events during the extension of double-stranded 5′-CCCCCCCCCCCCA-3′–5′-GGGGTGGGGGGGA-3′ oligonucleotide. Polymerase binds the oligonucleotide (1) and shifts A-nucleotide at the 3′ end of 5′-CCCCCCCCCCCCA-3′ until it is paired with T. A single-stranded template-primer fragment and a loop de novo are then formed as a result of the 3′ end slippage (2). The primer strand is synthesized complementary to the template sequence; residues incorporated into the primer are marked in red (3). The enzyme–DNA complex dissociates (4) and a loop relaxes into a structure with overhang at the 5′ end (5). The overhang cannot be used as a template for Klenow exo due to inability to pair A-nucleotide at the 3′ end of the primer with either nucleotide in sequence of the template.

Similar articles

Cited by

References

    1. Kornberg A. DNA Synthesis. San Francisco, CA: W. J. Freeman and Co.; 1974. DNA polymerase of E.coli. p. 103.
    1. Schachman H.K., Adler J., Radding C.M., Lehman I.R., Kornberg A. Enzymatic synthesis of deoxyribonucleic acid. VII. Synthesis of a polymer of deoxyadenylate and deoxythymidylate. J. Biol. Chem. 1960;235:3242–3249. - PubMed
    1. Radding C.M., Josse J., Kornberg A. Enzymatic synthesis of deoxyribonucleic acid. XII. A polymer of deoxyguanylate and deoxycytidylate. J. Biol. Chem. 1962;237:2869–2876. - PubMed
    1. Inman R.B., Baldwin R.L. Helix-random coil transitions in DNA homopolymer pairs. J. Mol. Biol. 1964;41:452–469. - PubMed
    1. Burd J.F., Wells R.D. Effect of incubation conditions on the nucleotide sequence of DNA products of unprimed DNA polymerase reactions. J. Mol. Biol. 1970;53:435–459. - PubMed

Publication types

MeSH terms