. 2005 Jan 28:5:8.
doi: 10.1186/1471-2148-5-8.

Bayesian and maximum likelihood phylogenetic analyses of protein sequence data under relative branch-length differences and model violation

Affiliations

Bayesian and maximum likelihood phylogenetic analyses of protein sequence data under relative branch-length differences and model violation

Jessica C Mar et al. BMC Evol Biol. .

Abstract

Background: Bayesian phylogenetic inference holds promise as an alternative to maximum likelihood, particularly for large molecular-sequence data sets. We have investigated the performance of Bayesian inference with empirical and simulated protein-sequence data under conditions of relative branch-length differences and model violation.

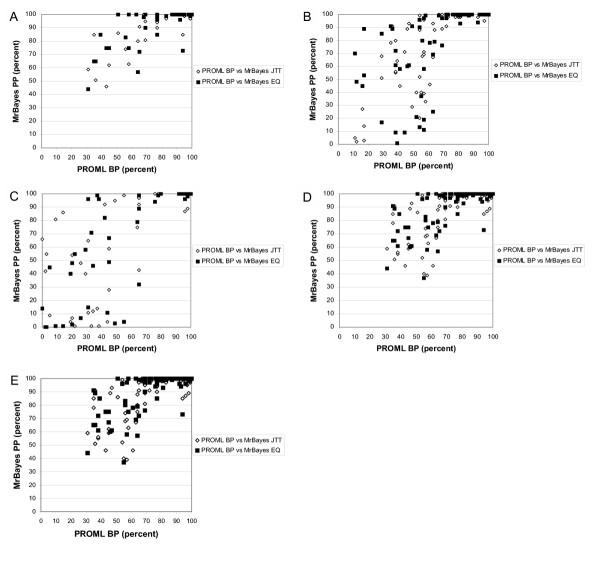
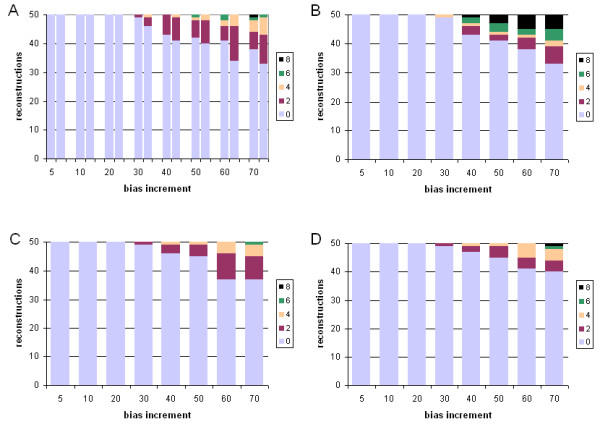
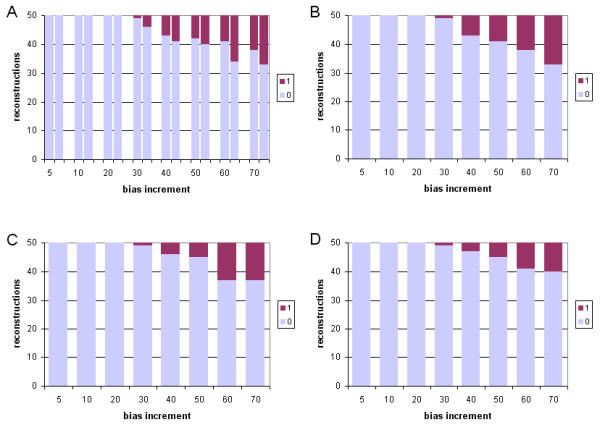
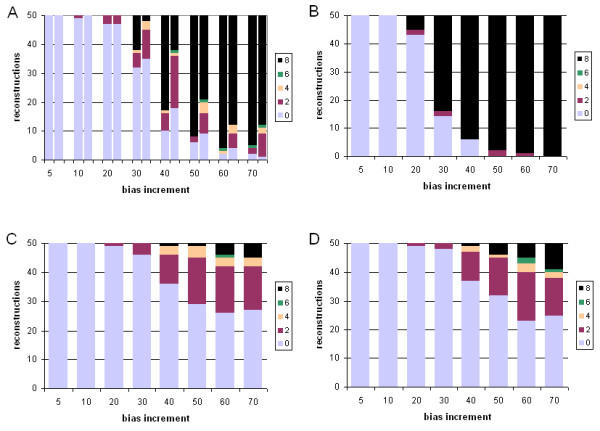
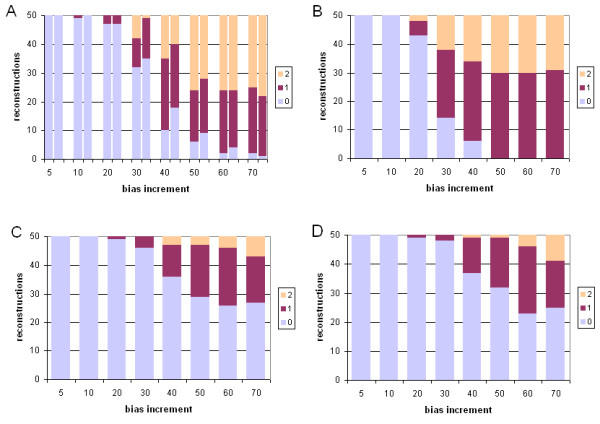
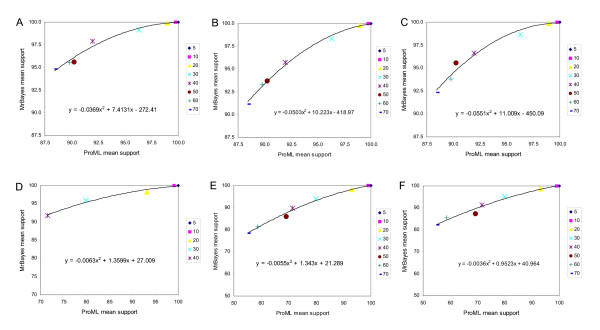
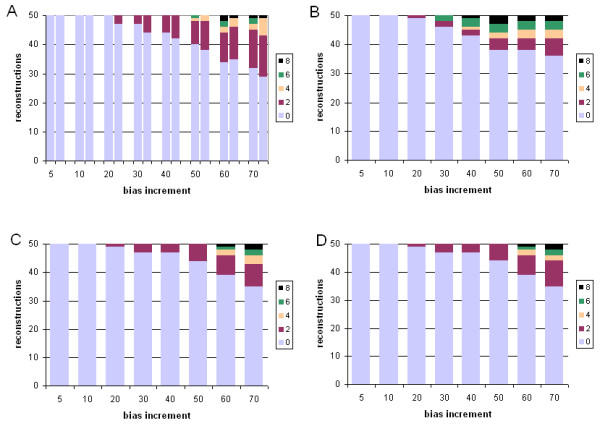
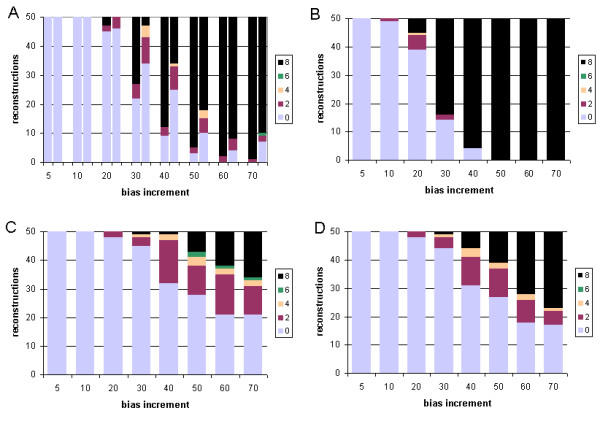
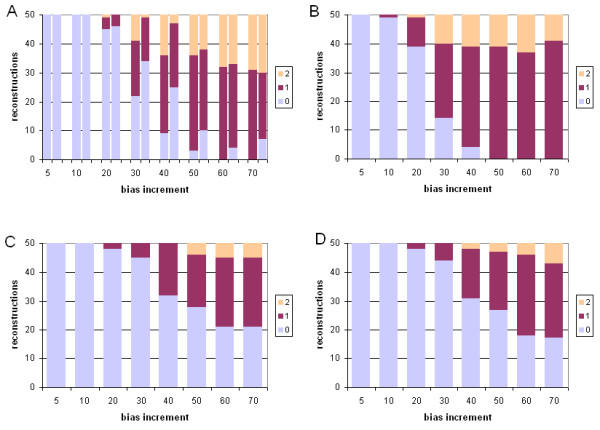
Results: With empirical protein-sequence data, Bayesian posterior probabilities provide more-generous estimates of subtree reliability than does the nonparametric bootstrap combined with maximum likelihood inference, reaching 100% posterior probability at bootstrap proportions around 80%. With simulated 7-taxon protein-sequence datasets, Bayesian posterior probabilities are somewhat more generous than bootstrap proportions, but do not saturate. Compared with likelihood, Bayesian phylogenetic inference can be as or more robust to relative branch-length differences for datasets of this size, particularly when among-sites rate variation is modeled using a gamma distribution. When the (known) correct model was used to infer trees, Bayesian inference recovered the (known) correct tree in 100% of instances in which one or two branches were up to 20-fold longer than the others. At ratios more extreme than 20-fold, topological accuracy of reconstruction degraded only slowly when only one branch was of relatively greater length, but more rapidly when there were two such branches. Under an incorrect model of sequence change, inaccurate trees were sometimes observed at less extreme branch-length ratios, and (particularly for trees with single long branches) such trees tended to be more inaccurate. The effect of model violation on accuracy of reconstruction for trees with two long branches was more variable, but gamma-corrected Bayesian inference nonetheless yielded more-accurate trees than did either maximum likelihood or uncorrected Bayesian inference across the range of conditions we examined. Assuming an exponential Bayesian prior on branch lengths did not improve, and under certain extreme conditions significantly diminished, performance. The two topology-comparison metrics we employed, edit distance and Robinson-Foulds symmetric distance, yielded different but highly complementary measures of performance.

Conclusions: Our results demonstrate that Bayesian inference can be relatively robust against biologically reasonable levels of relative branch-length differences and model violation, and thus may provide a promising alternative to maximum likelihood for inference of phylogenetic trees from protein-sequence data.


Figures

Figure 1
Figure 1
Empirical data: relationship between ML consensus bootstrap proportion and Bayesian posterior probability. Comparison of PROML bootstrap proportions (horizontal axes) with Bayesian posterior probabilities (vertical axes) for all internal nodes in trees inferred from 21 empirical protein-sequence datasets. Data are for trees inferred by gamma-corrected ML under JTT, versus those inferred by gamma-corrected Bayesian inference under JTT (open diamonds) or under EQ (closed squares), (A) for the 7 datasets for which the two ML and two Bayesian trees (see text) are topologically identical, (B) for the 10 datasets for which at least one ML or Bayesian tree (see text) differs slightly (edit distance ≤ 2) from the other three, (C) for the 4 datasets for which at least one tree differs more substantially (edit distance ≥ 3), (D) for the subset of internal nodes, within the latter 14 non-identical trees, that subtend identical subtrees, and (E) for data in panels (A) and (D) plotted together.
Figure 2
Figure 2
Comparative performance with simulated data: correct model, single long branch, symmetric distance Performance at different branch-length ratios of ML and Bayesian inference with simulated protein-sequence data evolved on a tree having a single long branch, measured as Robinson-Foulds symmetric distance. The JTT model was used for both sequence evolution and tree inference. Number (out of 50) of accurately reconstructed topologies (vertical axes) versus branch-length ratio (horizontal axes), where inference was by (A) gamma-corrected PROML, (B) Bayesian uncorrected for ASRV, with uniform prior, (C) gamma-corrected Bayesian with uniform prior, and (D) gamma-corrected Bayesian with exponential prior. Shading codes for each different distance are shown in the small box at the right of each panel (A-D). Thus the right-hand bar in panel B shows that using Bayesian inference uncorrected for ASRV and assuming a uniform prior, with a dataset generated on a tree in which one branch was lengthened 70-fold, 33 of 50 independent trees recovered the correct topology (Robinson-Foulds symmetric distance zero); 6 differed topologically in ways that involved a single node (distance two); 2 differed in ways that involved two adjacent nodes (distance four); 4 were at distance six; and the remaining 5 were at the maximum symmetric distance, eight. See text for explanation of dual bars in Panel A.
Figure 3
Figure 3
Comparative performance with simulated data: correct model, single long branch, edit distance. Performance at different branch-length ratios of ML and Bayesian inference with simulated protein-sequence data evolved on a tree having a single long branch, measured as edit distance. The JTT model was used for both sequence evolution and tree inference. Models, panels and axes are as in Figure 2.
Figure 4
Figure 4
Comparative performance with simulated data: correct model, two long branches, symmetric distance. Performance at different branch-length ratios of ML and Bayesian inference with simulated protein-sequence data evolved on a tree having two long branches, measured as Robinson-Foulds symmetric distance. The JTT model was used for both sequence evolution and tree inference. Models, panels and axes are as in Figure 2.
Figure 5
Figure 5
Comparative performance with simulated data: correct model, two long branches, edit distance. Performance at different branch-length ratios of ML and Bayesian inference with simulated protein-sequence data evolved on a tree having two long branches, measured as edit distance. The JTT model was used for both sequence evolution and tree inference. Models, panels and axes are as in Figure 2.
Figure 6
Figure 6
Simulated data: relationship between ML consensus bootstrap proportion and Bayesian posterior probability. Relationship between bootstrap proportion for ML consensus trees, and posterior probability for Bayesian trees, for datasets with one (A-C) or two (D-F) branches of relatively greater length. Bayesian trees were inferred (A and D) without ASRV correction and with a uniform prior, (B and E) with gamma correction for ASRV and with a uniform prior, and (C and F) with gamma correction and with an exponential prior. Panel D does not show data at relative branch-length ratios ≥ 50 because none of the trees inferred at these branch-length ratios recovered the known topology.
Figure 7
Figure 7
Comparative performance with simulated data: incorrect model, one long branch, symmetric distance. Performance at different branch-length ratios of ML and Bayesian inference with simulated protein-sequence data evolved on a tree having a single long branch, measured as Robinson-Foulds symmetric distance. Data were evolved under the mtmam model, but trees were inferred under the JTT model. Panels and axes are as in Figure 2.
Figure 8
Figure 8
Comparative performance with simulated data: incorrect model, one long branch, edit distance. Performance at different branch-length ratios of ML and Bayesian inference with simulated protein-sequence data evolved on a tree having a single long branch, measured as edit distance. Data were evolved under the mtmam model, but trees were inferred under the JTT model. Models, panels and axes are as in Figure 2.
Figure 9
Figure 9
Comparative performance with simulated data: incorrect model, two long branches, symmetric distance. Performance at different branch-length ratios of ML and Bayesian inference with simulated protein-sequence data evolved on a tree having two long branches, measured as Robinson-Foulds symmetric distance. Data were evolved under the mtmam model, but trees were inferred under the JTT model. Models, panels and axes are as in Figure 2.
Figure 10
Figure 10
Comparative performance with simulated data: incorrect model, two long branches, edit distance. Performance at different branch-length ratios of ML and Bayesian inference with simulated protein-sequence data evolved on a tree having two long branches, measured as edit distance. Data were evolved under the mtmam model, but trees were inferred under the JTT model. Models, panels and axes are as in Figure 2.

References

    1. Felsenstein J. Evolutionary trees from DNA sequences: a maximum likelihood approach. J Mol Evol. 1981;17:368–376. - PubMed
    1. Felsenstein J. Inferring phylogenies. Sunderland MA: Sinauer Associates; 2004.
    1. Felsenstein J. Confidence limits on phylogenies: an approach using the bootstrap. Evolution. 1985;39:783–791. - PubMed
    1. Kishino H, Miyata T, Hasegawa M. Maximum likelihood inference of protein phylogeny and the origin of chloroplasts. J Mol Evol. 1990;31:151–160.
    1. Hasegawa M, Kishino H. Accuracies of the simple methods for estimating the bootstrap probability of a maximum-likelihood tree. Mol Biol Evol. 1994;11:142–145.

Publication types

LinkOut - more resources