. 2005 Feb 8;102(6):2210-5.
doi: 10.1073/pnas.0406506102. Epub 2005 Jan 26.

Assignment of an essential role for the Neurospora frequency gene in circadian entrainment to temperature cycles

Affiliations

Assignment of an essential role for the Neurospora frequency gene in circadian entrainment to temperature cycles

Antonio M Pregueiro et al. Proc Natl Acad Sci U S A. .

Abstract

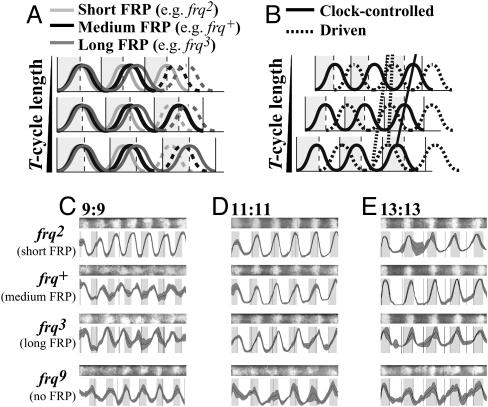
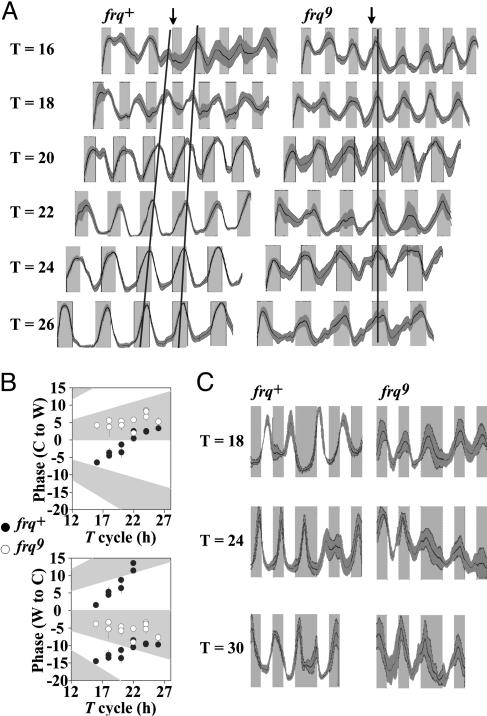
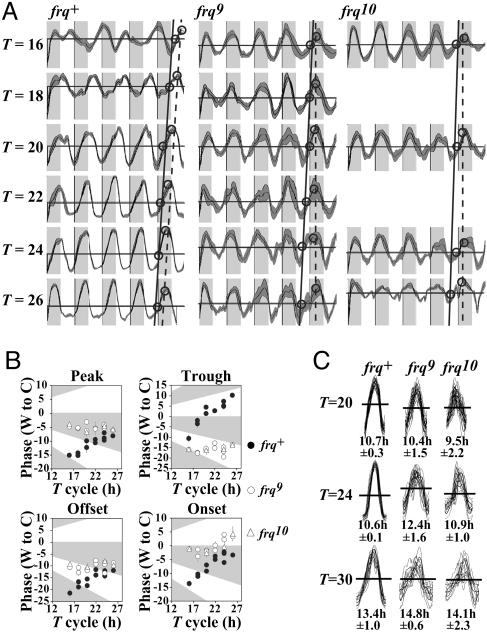
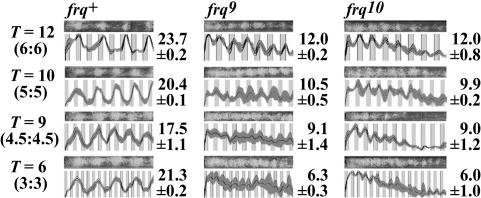
Circadian systems include slave oscillators and central pacemakers, and the cores of eukaryotic circadian clocks described to date are composed of transcription and translation feedback loops (TTFLs). In the model system Neurospora, normal circadian rhythmicity requires a TTFL in which a White Collar complex (WCC) activates expression of the frequency (frq) gene, and the FRQ protein feeds back to attenuate that activation. To further test the centrality of this TTFL to the circadian mechanism in Neurospora, we used low-amplitude temperature cycles to compare WT and frq-null strains under conditions in which a banding rhythm was elicited. WT cultures were entrained to these temperature cycles. Unlike those normal strains, however, frq-null mutants did not truly entrain to the same cycles. Their peaks and troughs always occurred in the cold and warm periods, respectively, strongly suggesting that the rhythm in Neurospora lacking frq function simply is driven by the temperature cycles. Previous reports suggested that a FRQ-less oscillator (FLO) could be entrained to temperature cycles, rather than being driven, and speculated that the FLO was the underlying circadian-rhythm generator. These inferences appear to derive from the use of a phase reference point affected by both the changing waveform and the phase of the oscillation. Examination of several other phase markers as well as results of additional experimental tests indicate that the FLO is, at best, a slave oscillator to the TTFL, which underlies circadian rhythm generation in Neurospora.


Figures

Fig. 1.
Fig. 1.
Phase of oscillation shown by systems with short, medium, or long FRPs compared with phases of clock-controlled and driven oscillations. (A) Model representing the effect of different-length temperature cycles on a rhythm regulated by a circadian clock. Phase (the position of the curve relative to the temperature transitions) will vary, reflecting the difference between the oscillator's inherent FRP and the period of the entraining cycle (T). When FRP and T are different, the oscillator adapts to the entraining cycle, and the rhythm assumes a stable phase relationship (seen here as the dashed curves on the 3rd day). Oscillators with different FRPs will establish different phase relationships with entraining cycles of a given length. (B) A rhythm generated by a circadian pacemaker (e.g., clock-controlled conidiation) will have a phase relationship with an entraining cycle such that, when entrained to different T cycles, the peak can occur before, at, or after the temperature transition (solid diagonal line). In a rhythm driven by temperature cycles (e.g., temperaturedriven conidiation), peaks and troughs fall at the same relative points, but the rate of rise and fall is influenced by the temperature. In this example, conidiation is initiated each time the temperature rises. The constant position of the peak with respect to the temperature rise is apparent (vertical dotted line) when the curves are lined up so that the third temperature rises are synchronous. However, if the temperature cycles influence the relative shape of the curve, then phase as determined by a point along the rise of the curve appears to change with T (diagonal dotted line). (C–E) Behavior of WT and frq mutant strains subjected to temperature cycles with different periods. Race tubes (at the top) and densitometric scans (at the bottom) representing Neurospora frq2, frq+, frq3, and frq9 strains grown under temperature cycles of 22°C/27°C of18h(9h/9h)(C), 22 h (11 h/11 h) (D), and 26 h (13 h/13 h) (E). Densitometric scans represent average pixels (darker central line) ± 1 SD (gray shading above and below the average curve) of at least five independent replicates (n ≥ 5 race tubes per genotype for each T cycle). Gray and white shading represents periods of growth at 22°C and 27°C, respectively.
Fig. 2.
Fig. 2.
frq+ strains are entrained, and frq9 strains are driven, by temperature cycles. (A) Densitometric tracings of the conidial banding rhythm entrained to 22°C/27°C temperature cycles of varying period length (indicated at left). Shading is as in Fig. 1; middle lines report average (n ≥ 6 race tubes) pixel density, and shading above and below this line marks ± 1 SD. The widths of the cool and warm periods were drawn to scale because the growth rate is higher at the higher temperature. The end of the third warm period in each tube has been aligned as indicated by the vertical arrow, and a line was drawn through the third (and in frq+ fourth) peaks to highlight the trends in phase. This line is sloped in WT (Left) showing the systematic change in phase as a function of T consistent with entrainment, but the line is vertical in the frq-null strain (Right). Similar results were obtained in all three laboratories; plotted data are from one laboratory. (B) The phase of the rhythm peak under different period length (T) cycles was measured as the average number of hours the peaks occurred after (-) or before (+) the cool (22°C) to warm (27°C) (Upper) or warm to cool (Lower) transitions for frq9 (○) and frq+ (•). When plotting the phase relative to the warm to cool transition, the frq+ peak cannot always be unambiguously plotted as occurring before or after the transition. Thus, we plotted the results as delays (negative values) as well as advances (positive values). This plot represents all data collected independently in three different laboratories. Each data point is an average phase value from at least three cycles per race tube from n ≥ 6 race tubes ± 1 SD. To test how well entrainment period length could predict phase, we performed a linear regression analysis and found a highly significant linear relationship (P < 0.001) between phase and T in the frq+ strain. However, in frq9 the relationship was not significant (P > 0.05), indicating that this strain is not entrained. (C) Densitometric scans of frq+ (Left) and frq9 (Right) strains under cycles of 9 h/9 h (Top), 12 h/12 h (Middle), and 15 h/15 h (Bottom) at 22°C and 27°C. After the fourth full temperature cycle (first two cycles not shown), the temperature was held at 22°C for another half-cycle before resuming regular cycling. In frq+, the oscillation continues, whereas in frq9, cycling ceases until the temperature rises again, consistent with the rhythm being driven. Data are from one laboratory, n = 6 race tubes ± 1 SD; see also Fig. 5, which is published as supporting information on the PNAS web site.
Fig. 3.
Fig. 3.
Choice of phase reference point influences the derived phase of the rhythm. (A) Data for frq+ and frq9 from Fig. 2 A, as well as data from the frq-null strain frq10 (10), are drawn with different T cycles scaled to the same size. As phase reference points, “onsets” (solid lines) and peaks (dotted lines, diagonal in frq+ and vertical in frq9 and frq10) were used and are drawn to show the trends. (B) The data from A, as well as corresponding data from all three laboratories, were analyzed with chrono by using phase reference points as shown. Statistics are shown in Table 1, whose data reveal a strong dependence of phase on T for frq+ (i.e., a line whose slope approaches or is >1) consistent with entrainment; in contrast, slopes close to 0, for the frq-null data tabulated, indicate a driven rhythm. Significance reflects the probability that the slope of the line is 0. (C) Conidial density from replicate tubes was averaged, and the profiles from each T were divided into individual days and superimposed. The average width of the bands from each T cycle was measured along the line used by chrono for onset determination and is indicated under each profile as average hours ± 1 SD.
Fig. 4.
Fig. 4.
High-frequency temperature cycles cannot elicit demultiplication in the absence of functional frq. frq+ and frq-null strains were subjected to temperature cycles (T) whose durations ranged downward from the circadian range, as indicated on the far left of the figure. Whereas frq+ is able to demultiply to 18-, 20-, and 24-h periodicities, and free-runs in shorter duration cycles, both frq-null strains show conidiation being driven by temperature cycles for all T's applied. On the right of each profile is the period length (in hours) ± 1 SD estimated from at least six race tubes. Similar experiments yielded equivalent results independently in two laboratories; data reported are from one laboratory.

Similar articles

Cited by

References

    1. Dunlap, J. C. (1998) Science 280, 1548-1549. - PubMed
    1. Young, M. W. & Kay, S. A. (2001) Nat. Rev. Genet. 2, 702-715. - PubMed
    1. Sehgal, A. (2003) Molecular Biology of Circadian Rhythms (Wiley, New York).
    1. Pittendrigh, C. S. (1960) Cold Spring Harbor Symp. Quant. Biol. 25, 159-184. - PubMed
    1. Heintzen, C., Nater, M., Apel, K. & Staiger, D. (1997) Proc. Natl. Acad. Sci. USA 94, 8515-8520. - PMC - PubMed

Publication types

Substances

LinkOut - more resources