

Predictions of patterns of response to artificial selection in lines derived from natural populations
- PMID: 15677752
- PMCID: PMC1448869
- DOI: 10.1534/genetics.104.032573
Predictions of patterns of response to artificial selection in lines derived from natural populations
Abstract
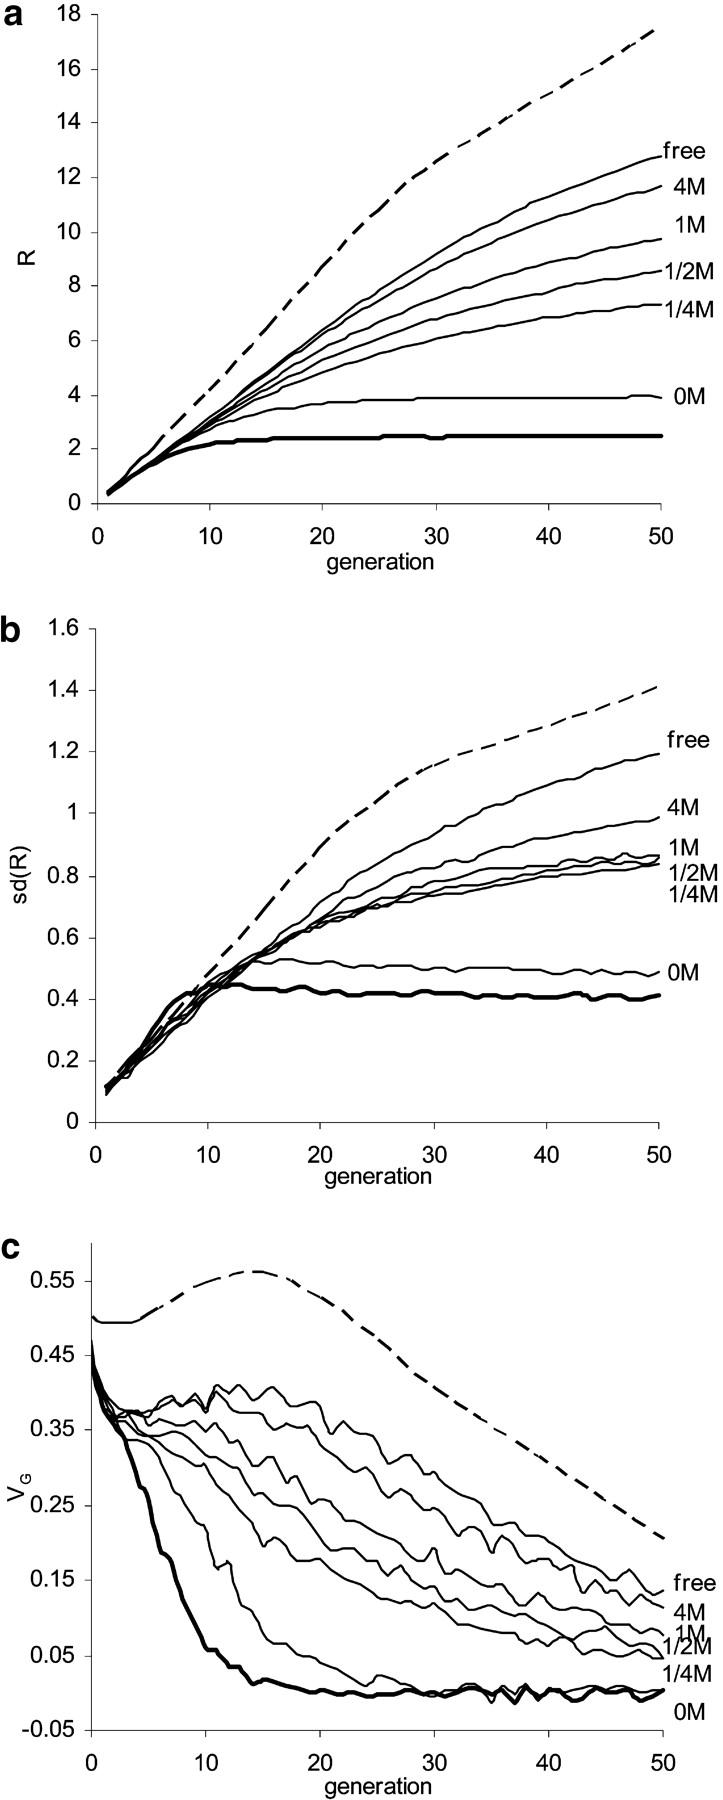
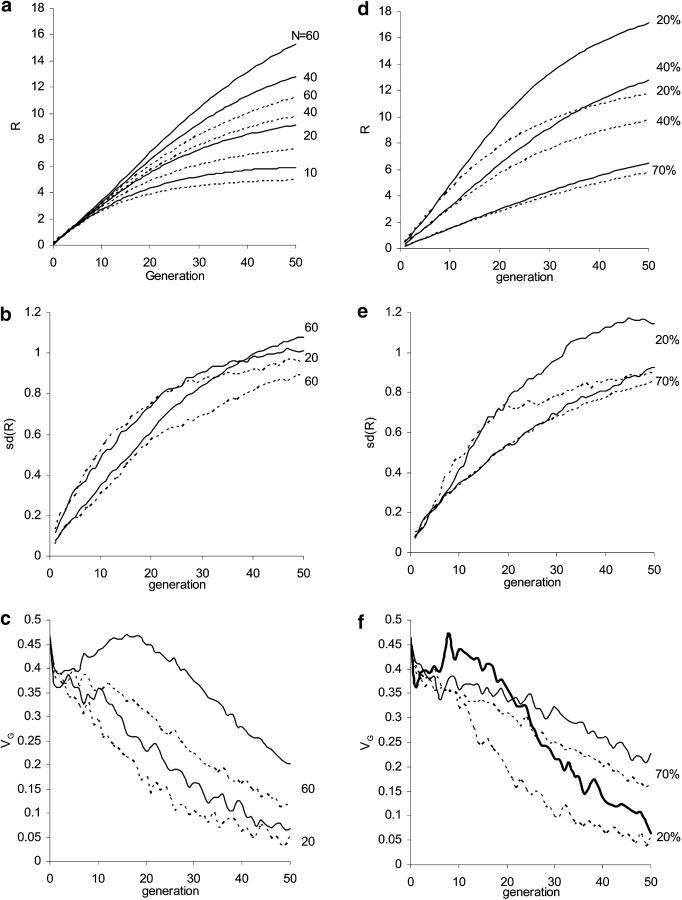
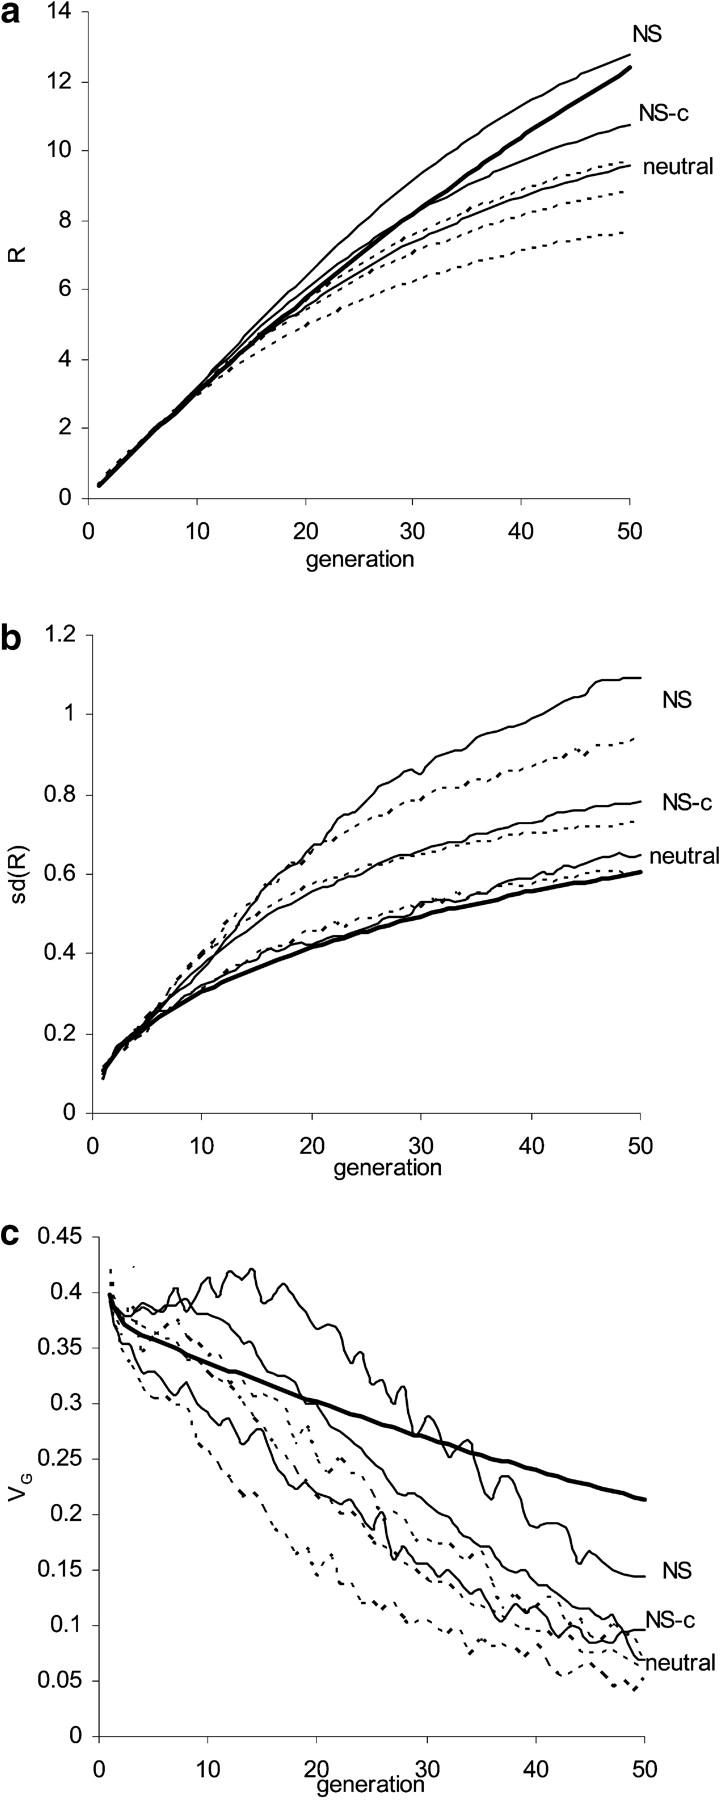
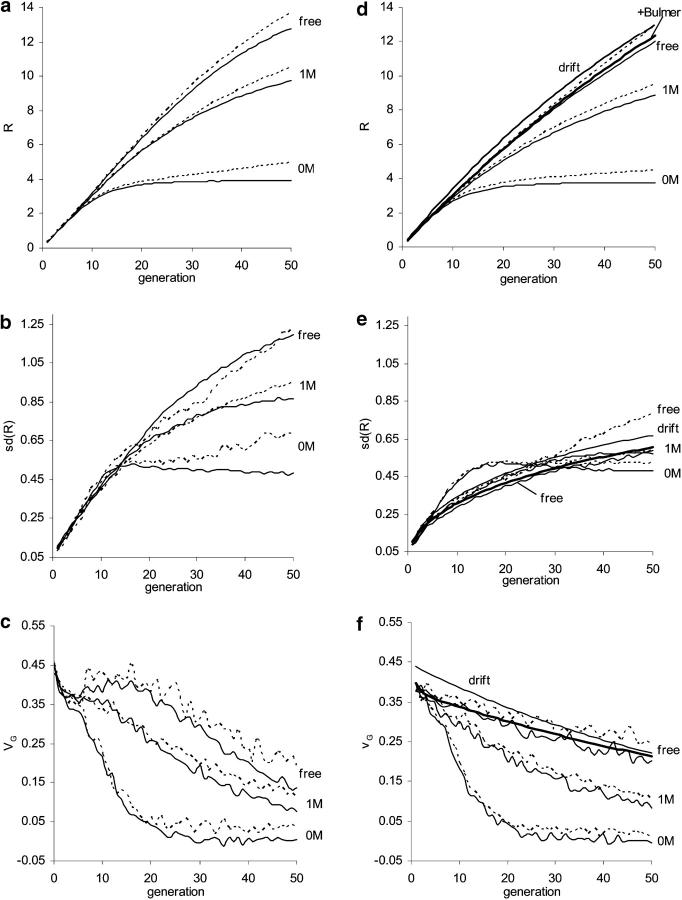
The pattern of response to artificial selection on quantitative traits in laboratory populations can tell us something of the genetic architecture in the natural population from which they were derived. We modeled artificial selection in samples drawn from natural populations in which variation had been maintained by recurrent mutation, with genes having an effect on the trait, which was subject to real stabilizing selection, and a pleitropic effect on fitness (the joint-effect model). Natural selection leads to an inverse correlation between effects and frequencies of genes, such that the frequency distribution of genes increasing the trait has an extreme U-shape. In contrast to the classical infinitesimal model, an early accelerated response and a larger variance of response among replicates were predicted. However, these are reduced if the base population has been maintained in the laboratory for some generations by random sampling prior to artificial selection. When multiple loci and linkage are also taken into account, the gametic disequilibria generated by the Bulmer and Hill-Robertson effects are such that little or no increase in variance and acceleration of response in early generations of artificial selection are predicted; further, the patterns of predicted responses for the joint-effect model now become close to those of the infinitesimal model. Comparison with data from laboratory selection experiments shows that, overall, the analysis did not provide clear support for the joint-effect model or a clear case for rejection.
Figures

Similar articles
-
Clines in polygenic traits.Genet Res. 1999 Dec;74(3):223-36. doi: 10.1017/s001667239900422x. Genet Res. 1999. PMID: 10689800 Review.
-
Commentary: Fisher's infinitesimal model: A story for the ages.Theor Popul Biol. 2017 Dec;118:46-49. doi: 10.1016/j.tpb.2017.09.003. Epub 2017 Oct 5. Theor Popul Biol. 2017. PMID: 28987627
-
Quantitative genetic models for the balance between migration and stabilizing selection.Genet Res. 2000 Dec;76(3):285-93. doi: 10.1017/s0016672300004742. Genet Res. 2000. PMID: 11204975
-
Genetic and statistical analyses of strong selection on polygenic traits: what, me normal?Genetics. 1994 Nov;138(3):913-41. doi: 10.1093/genetics/138.3.913. Genetics. 1994. PMID: 7851785 Free PMC article.
-
"Conversion" of epistatic into additive genetic variance in finite populations and possible impact on long-term selection response.J Anim Breed Genet. 2017 Jun;134(3):196-201. doi: 10.1111/jbg.12270. J Anim Breed Genet. 2017. PMID: 28508485 Review.
Cited by
-
Increased genetic gains in sheep, beef and dairy breeding programs from using female reproductive technologies combined with optimal contribution selection and genomic breeding values.Genet Sel Evol. 2015 Sep 14;47(1):70. doi: 10.1186/s12711-015-0151-3. Genet Sel Evol. 2015. PMID: 26370143 Free PMC article.
-
Natural dispersal is better than translocation for reducing risks of inbreeding depression in eastern black rhinoceros (Diceros bicornis michaeli).Proc Natl Acad Sci U S A. 2025 Jun 10;122(23):e2414412122. doi: 10.1073/pnas.2414412122. Epub 2025 Jun 3. Proc Natl Acad Sci U S A. 2025. PMID: 40460127
-
Quantifying resistance to myxomatosis in wild rabbits produces novel evolutionary insights.Epidemiol Infect. 2023 Oct 12;151:e182. doi: 10.1017/S0950268823001668. Epidemiol Infect. 2023. PMID: 37823321 Free PMC article.
-
Quantitative genetics in the genomics era.Curr Genomics. 2012 May;13(3):196-206. doi: 10.2174/138920212800543110. Curr Genomics. 2012. PMID: 23115521 Free PMC article.
-
Development of a Nasonia vitripennis outbred laboratory population for genetic analysis.Mol Ecol Resour. 2014 May;14(3):578-87. doi: 10.1111/1755-0998.12201. Epub 2013 Dec 12. Mol Ecol Resour. 2014. PMID: 24215457 Free PMC article.
References
-
- Atkins, K. D., and R. Thompson, 1986. Predicted and realised responses to selection for an index of bone length and body weight in Scottish Blackface sheep. Anim. Prod. 43: 421–435.
-
- Barton, N. H., and P. D. Keightley, 2002. Understanding quantitative genetic variation. Nat. Genet. 3: 11–21. - PubMed
-
- Bulmer, M. G., 1971. The effect of selection on genetic variability. Am. Nat. 105: 201–211.
Publication types
MeSH terms
LinkOut - more resources
Full Text Sources
