. 2005 Feb;144(4):595-604.
doi: 10.1038/sj.bjp.0706113.

Effects of diltiazem and nifedipine on transient outward and ultra-rapid delayed rectifier potassium currents in human atrial myocytes

Affiliations

Effects of diltiazem and nifedipine on transient outward and ultra-rapid delayed rectifier potassium currents in human atrial myocytes

Zhan Gao et al. Br J Pharmacol. 2005 Feb.

Abstract

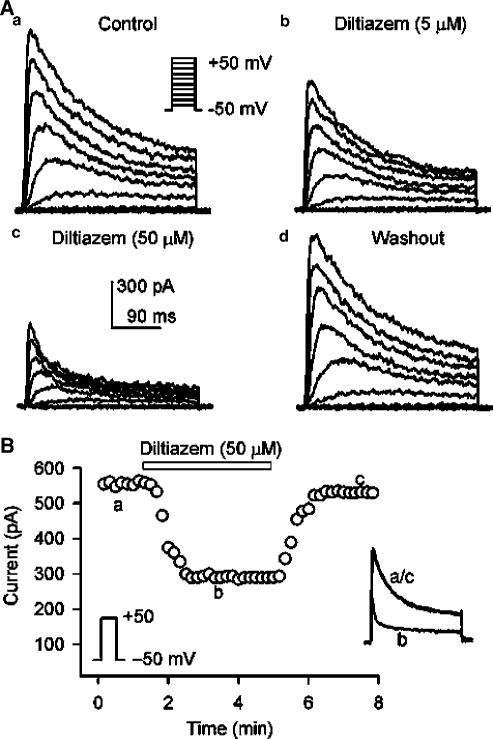
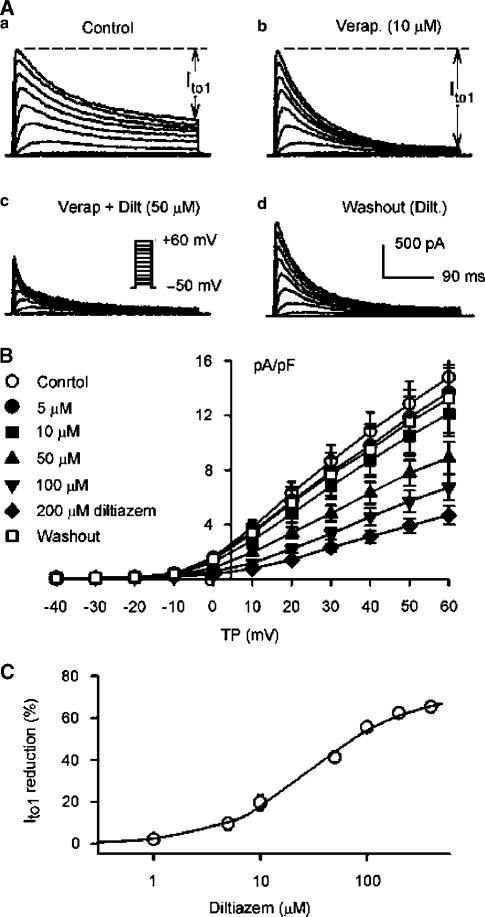
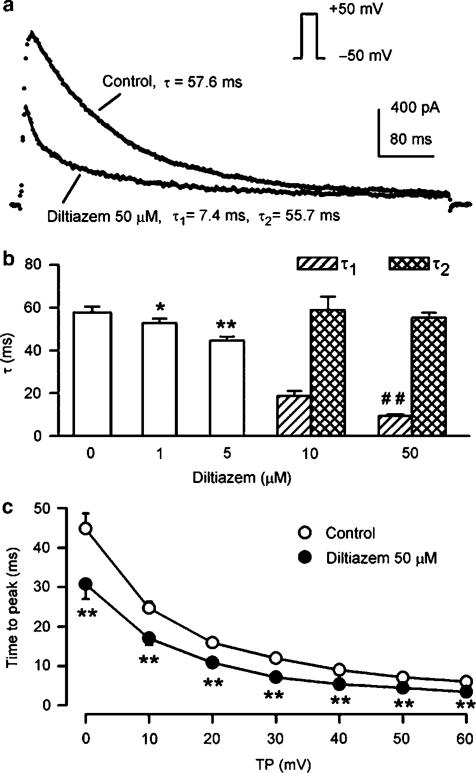
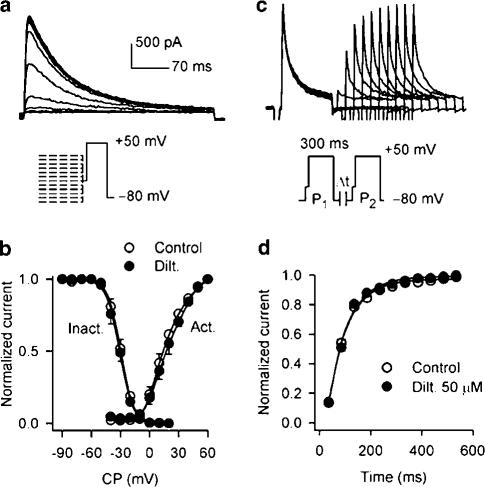
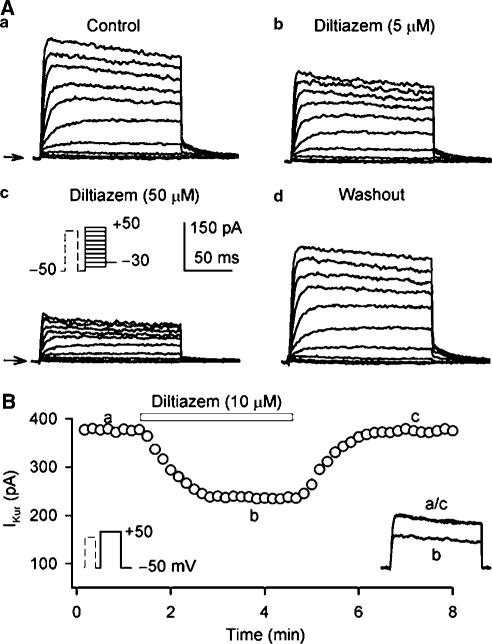
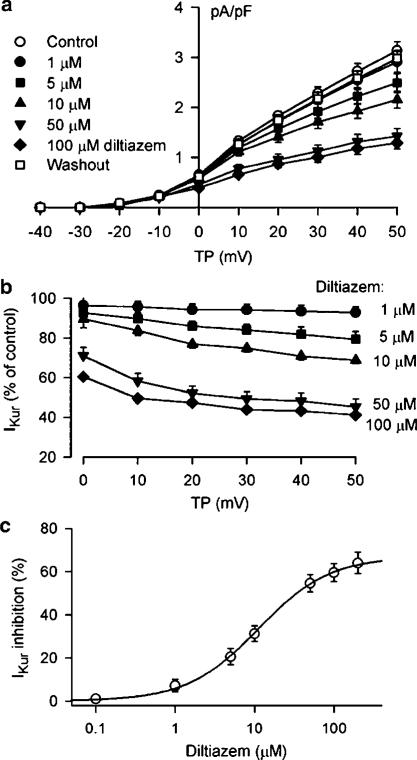
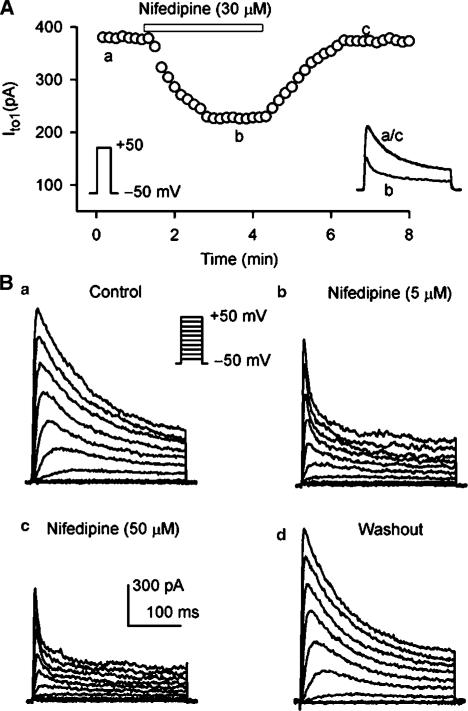
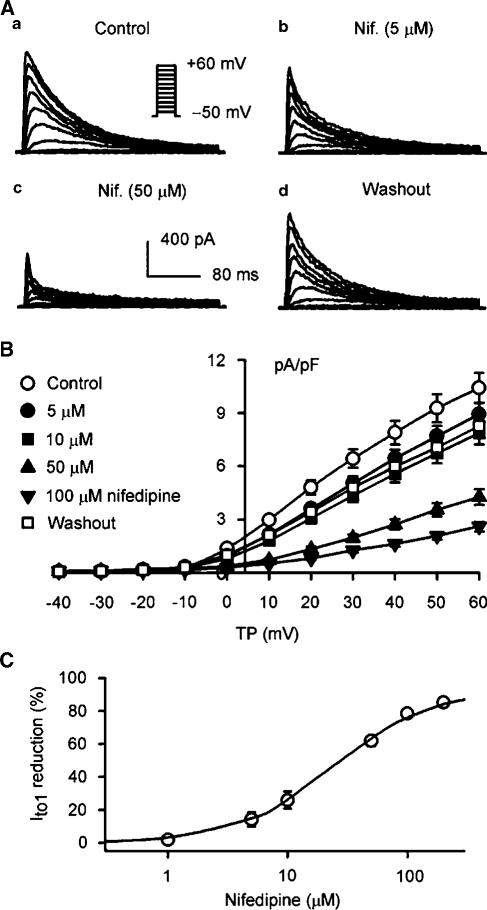
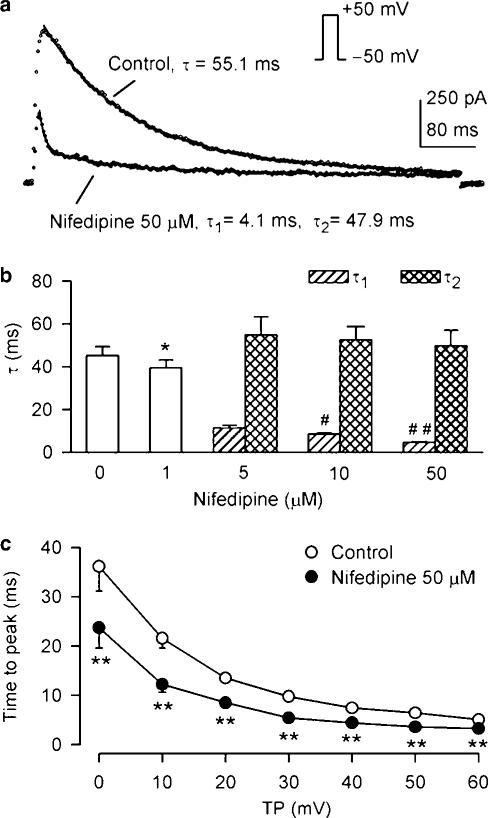
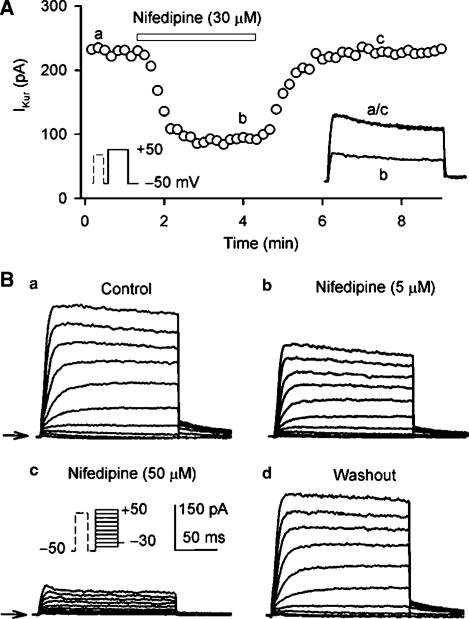
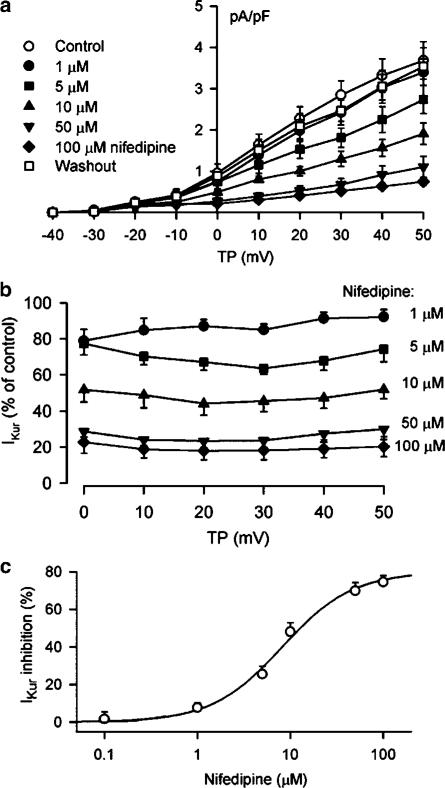
1. It is unknown whether the widely used L-type Ca(2+) channel antagonists diltiazem and nifedipine would block the repolarization K(+) currents, transient outward current (I(to1)) and ultra-rapid delayed rectifier K(+) current (I(Kur)), in human atrium. The present study was to determine the effects of diltiazem and nifedipine on I(to1) and I(Kur) in human atrial myocytes with whole-cell patch-clamp technique. 2. It was found that diltiazem substantially inhibited I(to1) in a concentration-dependent manner, with an IC(50) of 29.2+/-2.4 microM, and nifedipine showed a similar effect (IC(50)=26.8+/-2.1 muM). The two drugs had no effect on voltage-dependent kinetics of the current; however, they accelerated I(to1) inactivation significantly, suggesting an open channel block. 3. In addition, diltiazem and nifedipine suppressed I(Kur) in a concentration-dependent manner (at +50 mV, IC(50)=11.2+/-0.9 and 8.2+/-0.8 microM, respectively). These results indicate that the Ca(2+) channel blockers diltiazem and nifedipine substantially inhibit I(to1) and I(Kur) in human atrial myocytes.


Figures

Figure 1
Figure 1
Diltiazem effect on Ito1. (A) Representative voltage-dependent Ito1 (capacitance compensated) recorded in an atrial myocyte with the voltage steps protocol shown in the inset at 0.2 Hz under control conditions (a), in the presence of 5 and 50 μM diltiazem (b, c). Ito1 was substantially inhibited by the application of diltiazem for 6 min, and the effect was recovered by the drug washout for 8 min (d). (B) Time-dependent effect of 50 μM diltiazem on Ito1 elicited by the voltage step shown in the left inset delivered every 10 s in a typical experiment. Ito1 measured was peak to ‘quasi'-steady-state level. The original Ito1 traces at corresponding time points are shown in the right inset of the panel.
Figure 2
Figure 2
Effects of verapamil and diltiazem on Ito1. (A) Ito1 traces recorded with the voltage protocol as shown in the inset of (c) in a representative myocytes during control (a), in the presence of 10 μM verapamil (Verap.) for 6 min (b), co-presence of verapamil and 50 μM diltiazem (Dilt.) for 6 min (c), and washout of diltiazem for 8 min. Verapamil actually induced an increase of measured Ito1 by selectively inhibiting IKur. (B) I–V relationships of Ito1 in the presence of 10 μM verapamil (control), co-presence of verapamil and 5, 10, 50, 100, and 200 μM diltiazem (6 min for each concentration), and after the drug washout for 10 min. Diltiazem inhibited Ito1 in a concentration-dependent manner (P<0.05 or 0.01 vs control, and the effect was reversed by 90% after the drug washout. The statistical significance was analyzed by repeated-measures ANOVA. (C) Concentration–response relationship for diltiazem inhibition of Ito1. Symbols are mean data at +50 mV (the error bars are smaller than the size of the data symbol), and solid line is the best-fit Hill equation, IC50=29.2±2.4 μM, Hill co-efficient=0.98±0.08 (n=6), and Emax=65.2%.
Figure 3
Figure 3
Effects of diltiazem on time-dependent kinetics of Ito1. (a) Ito1 traces recorded from a representative cell upon a 300-ms voltage step to +50 from −50 mV in the presence of 10 μM verapamil (control) and co-presence of verapamil and 50 μM diltiazem. Raw data (points) of Ito1 under control conditions were fitted to a monoexponential function (solid lines, superimposed with raw data) with time constants shown. After the application of 50 μM diltiazem, the data were fitted only by a biexponential equation, with fast and slow time constants (τ1 and τ2) shown. (b) Mean values of time constants at +50 mV under control conditions, in the presence of 1, 5, 10, and 50 μM diltiazem. The time constant was reduced by the application of 1 and 5 μM diltiazem (n=7, *P<0.05, **P<0.01 vs control). Diltiazem at concentrations higher than 10 μM had τ1 and τ2. The τ1 decreased with increasing diltiazem concentration (##P<0.01 vs 10 μM diltiazem), and the τ2 did not show significant difference. (c) Time to peak of Ito1 activation at 0 to +60 mV under control conditions and in the presence of 50 μM diltiazem. Diltiazem significantly reduced the time to peak of Ito1 (n=7, **P<0.01 vs control). The statistical significance was analyzed by repeated-measures ANOVA.
Figure 4
Figure 4
Effects of diltiazem on voltage-dependence and restoration of Ito1. (a) Representative current traces and protocol (inset) used to evaluate voltage-dependent inactivation Ito1 recorded in the presence of 10 μM verapamil. (b) Voltage-dependent variables for Ito1 activation (Act.) and inactivation (Inact.) were fitted to the Boltzmann distribution: y=1/{1+exp[(VmV0.5)/S]}, where Vm is membrane potential, V0.5 is the midpoint, and S is slope. For activation, V0.5 and S were 16.9±1.4 and −11.2±0.3 mV for control, and 18.4±0.9 and −11.9±0.4 mV for 50 μM diltiazem (Dilt.) treatment (n=7, P=NS). For inactivation, V0.5 and S were –29.2±1.1 and 7.5±0.6 mV under control conditions, and −30.4±1.4 and 7.6±0.8 mV in the presence of 50 μM diltiazem (n=6, P=NS). (c) Representative current traces recorded in a typical experiment in the presence of 10 μM verapamil by 300-ms paired pulses to +50 mV after a 30-ms step of −40 mV (to inactivate INa) from −80 mV with varying P1 and P2 interval (inset), which are used for assessing time-dependent recovery of Ito1 from inactivation. (d) Mean data for time course of recovery of Ito1 from inactivation in the absence and presence of 50 μM diltiazem in six cells. Data were best fit to monoexponential function. No change in recovery time constant of Ito1 was observed after the application of diltiazem (n=6, P=NS).
Figure 5
Figure 5
Effect of diltiazem on IKur. (A) Representative voltage-dependent IKur (capacitance compensated) recorded at 0.2 Hz in a typical experiment with a 100-ms prepulse to +40 mV to inactivate Ito1, followed by 150-ms test pulses to between –40 and +50 from –50 mV after a 10-ms interval, then to –30 mV (as shown in the inset of (c) under control conditions (a), in the presence of 5 and 50 μM diltiazem (b, c). IKur was substantially suppressed by the application of diltiazem, and the effect was significantly recovered by washout of the drug for 6 min (d). (B) Time-dependent effect of 10 μM diltiazem on IKur elicited by 150-ms voltage step to +50 from −50 mV (as shown in the left inset) delivered every 10 s. The original IKur races at corresponding time points are shown in the right inset.
Figure 6
Figure 6
Concentration-dependent effect of diltiazem on IKur. (a) I–V relationships of IKur under control conditions, in the presence of 1, 5, 10, 50, and 100 μM diltiazem (6 min for each concentration), and after the drug washout for 10 min. Diltiazem inhibited IKur in a concentration-dependent manner, and the effect was reversed by 95% (at +50 mV) after the drug washout. (b) Percent reduction of IKur at 0 to +50 mV by diltiazem with multiple concentrations. Diltiazem significantly inhibited IKur at concentrations from 1 μM (P<0.05 vs control) to 5, 10, 50, and 100 μM (n=8, P<0.01 vs control). Significant voltage dependence was observed for the drug effect at 10–100 μM, and stronger effect was observed at potentials positive to +10 and +50 mV (P<0.05 or 0.01 vs 0 mV). The statistical significance was analyzed by repeated-measures ANOVA. (c) Concentration–response relationships of IKur block by diltiazem at +50 mV. The symbols are mean values of inhibitory effect in cells exposed to different concentrations (0.1–200 μM) of diltiazem. Solid lines were best fit to Hill equation. Mean IC50 was 11.2±0.9 μM, Hill co-efficient was 0.96±0.07, and Emax was 64% (n=7).
Figure 7
Figure 7
Inhibition of Ito1 by nifedipine. (A) Time-dependent effect of 30 μM nifedipine on Ito1 elicited by voltage step to +50 from −50 mV (as shown in the left inset) delivered every 10 s. Nifedipine reversibly suppressed Ito1. The original Ito1 traces at corresponding time points are shown in the right inset. (B) Voltage-dependent Ito1 traces recorded with the voltage protocol as shown in the inset in a typical experiment under control conditions (a), in the presence of 5 and 50 μM nifedipine (b, c) for 5 min. Ito1 was significantly inhibited by nifedipine, and the effect recovered upon the drug washout for 6 min.
Figure 8
Figure 8
Effect of nifedipine on Ito1 under conditions of inhibiting IKur with 10 μM verapamil. (A) Ito1 traces recorded with the same voltage protocol as shown in the inset in a representative myocyte during control (a, 10 μM verapamil), in the co-presence of verapamil and 5 (b) and 50 (c) μM nifedipine (Nif.) for 6 min, and washout of nifedipine for 10 min (d). (B) I–V relationships of Ito1 under control conditions (10 μM verapamil), in the co-presence of verapamil and 5, 10, 50, 100 μM nifedipine (6 min for each concentration), and after the drug washout for 10 min. Nifedipine (5–100 μM) significantly inhibited Ito1 at voltages from 0 to +60 mV (n=7, P<0.05 or 0.01). The statistical significance was analyzed by repeated-measures ANOVA. (C) Concentration-dependent response of Ito1 to nifedipine. IC50 at +50 mV was 26.8±2.1 μM with a Hill co-efficient of 0.97±0.02 (n=6), and Emax was 85.1%.
Figure 9
Figure 9
Effects of nifedipine on inactivation and time to peak of Ito1. (a) Ito1 traces recorded in a typical experiment upon a 300-ms voltage step to +50 from −50 mV in the presence of 10 μM verapamil (control), and co-presence of verapamil and 50 μM nifedipine. Raw data (points) of Ito1 under control conditions were well fit to a mono-exponential function (solid lines, superimposed with raw data) with time constant shown. The data after application of 50 μM nifedipine were only fit to a biexponential equation with fast and slow time constants (τ1 and τ2) shown. (b) Mean values of Ito1 inactivation time constants under control conditions, and in the presence of 1 (n=7, P<0.05 vs control), 5, 10 and 50 μM nifedipine (#P<0.05, ##P<0.01 vs 5 μM nifedipine). (c) Time to peak of Ito1 as a function of test potentials under control conditions and in the presence of 50 μM nifedipine. The time to peak of Ito1 was significantly reduced at 0 to +60 mV by the application of diltiazem (n=6, **P<0.01 vs control). The statistical significance was analyzed by repeated-measures ANOVA.
Figure 10
Figure 10
Effect of nifedipine on IKur. (A) Time-dependent effect of 30 μM nifedipine on IKur elicited by voltage protocol shown in the left inset delivered every 10 s in a typical experiment. Nifedipine reversibly suppressed IKur. (B) Voltage-dependent IKur recorded in a representative myocyte by the voltage protocol shown in the inset under control conditions (a), in the presence of 5 and 50 μM nifedipine for 5 min (b, c), and after wash out of the drug for 6 min (d). Nifedipine substantially suppressed IKur, and the effect recovered upon the drug washout.
Figure 11
Figure 11
Nifedipine effect on voltage-dependent IKur. (a) I–V relationships of IKur under control conditions, in the presence of 1, 5, 10, 50, and 100 μM nifedipine (6 min for each concentration), and after the drug washout for 10 min. Nifedipine inhibited IKur in a concentration-dependent manner, and the effect was reversed by 95% (at +50 mV) by washout of the drug for 10 min. (b) Percent inhibition of IKur at voltages from 0 to +50 mV by nifedipine with multiple concentrations. Nifedipine significantly inhibited IKur at concentrations from 1 to 5, 10, 50, and 100 μM (n=8, P<0.05 or 0.01 vs control), and no voltage-dependent effect was observed for the drug action. The statistical significance was analyzed by the repeated measures ANOVA. (c) Concentration-dependent inhibition of IKur by nifedipine at +50 mV. The symbols are mean values of inhibitory effect in seven cells exposed to different concentrations of nifedipine. Solid lines were fit to Hill equation. Mean IC50 was 8.2±0.8 μM, Hill co-efficient was 1.2±0.2, and Emax was 76%.

Similar articles

Cited by

References

    1. AVDONIN V., SHIBATA E.F., HOSHI T. Dihydropyridine action on voltage-dependent potassium channels expressed in Xenopus oocytes. J. Gen. Physiol. 1997;109:169–180. - PMC - PubMed
    1. CALMELS T.P., FAIVRE J.F., CHEVAL B., JAVRE J.L., ROUANET S., BRIL A. hKv4.3 channel characterization and regulation by calcium channel antagonists. Biochem. Biophys. Res. Commun. 2001;281:452–560. - PubMed
    1. COURTEMANCHE M., RAMIREZ R.J., NATTEL S. Ionic mechanisms underlying human atrial action potential properties: insights from a mathematical model. Am. J. Physiol. 1998;275:H301–H321. - PubMed
    1. COURTEMANCHE M., RAMIREZ R.J., NATTEL S. Ionic targets for drug therapy and atrial fibrillation-induced electrical remodeling: insights from a mathematical model. Cardiovasc. Res. 1999;42:477–489. - PubMed
    1. DE LEEUW P.W., BIRKENHAGER W.H. The effects of calcium channel blockers on cardiovascular outcomes: a review of randomised controlled trials. Blood Press. 2002;11:71–78. - PubMed

Publication types

MeSH terms