Comparative Study
. 2005 Feb;3(2):e27.
doi: 10.1371/journal.pbio.0030027. Epub 2005 Jan 25.

A functional neuroimaging study of sound localization: visual cortex activity predicts performance in early-blind individuals

Affiliations
Comparative Study

A functional neuroimaging study of sound localization: visual cortex activity predicts performance in early-blind individuals

Frédéric Gougoux et al. PLoS Biol. 2005 Feb.

Abstract

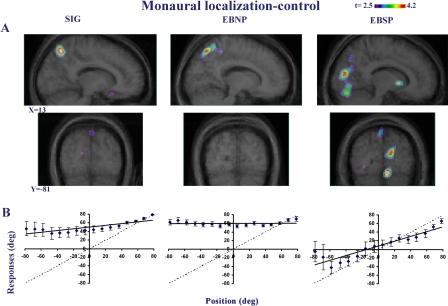
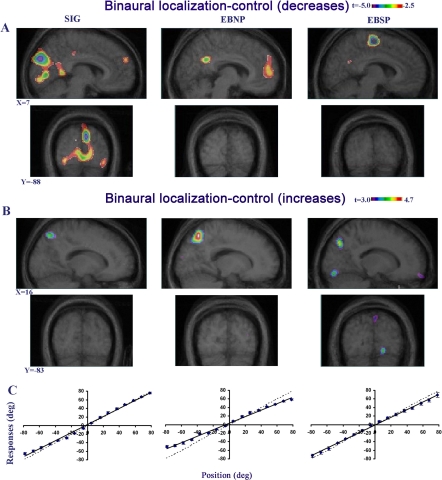
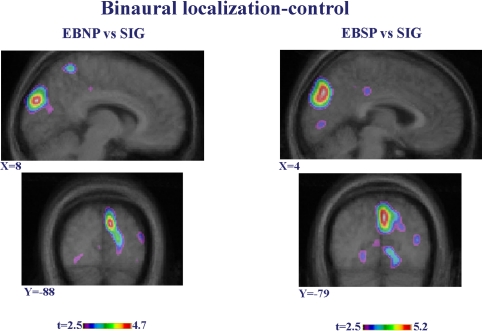
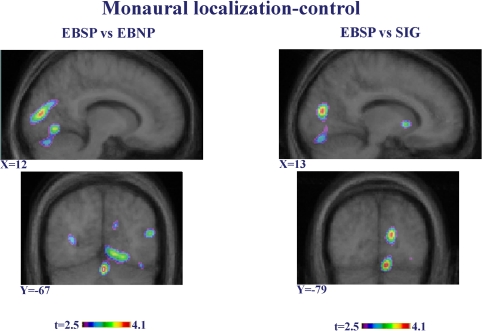
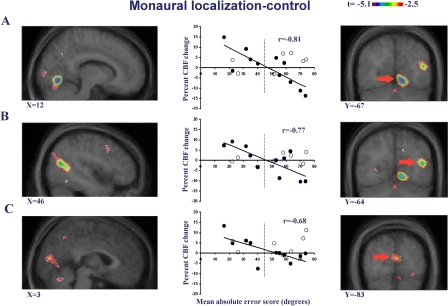
Blind individuals often demonstrate enhanced nonvisual perceptual abilities. However, the neural substrate that underlies this improved performance remains to be fully understood. An earlier behavioral study demonstrated that some early-blind people localize sounds more accurately than sighted controls using monaural cues. In order to investigate the neural basis of these behavioral differences in humans, we carried out functional imaging studies using positron emission tomography and a speaker array that permitted pseudo-free-field presentations within the scanner. During binaural sound localization, a sighted control group showed decreased cerebral blood flow in the occipital lobe, which was not seen in early-blind individuals. During monaural sound localization (one ear plugged), the subgroup of early-blind subjects who were behaviorally superior at sound localization displayed two activation foci in the occipital cortex. This effect was not seen in blind persons who did not have superior monaural sound localization abilities, nor in sighted individuals. The degree of activation of one of these foci was strongly correlated with sound localization accuracy across the entire group of blind subjects. The results show that those blind persons who perform better than sighted persons recruit occipital areas to carry out auditory localization under monaural conditions. We therefore conclude that computations carried out in the occipital cortex specifically underlie the enhanced capacity to use monaural cues. Our findings shed light not only on intermodal compensatory mechanisms, but also on individual differences in these mechanisms and on inhibitory patterns that differ between sighted individuals and those deprived of vision early in life.


Figures

Figure 1
Figure 1. Monaural Sound Localization in PET Experiments Performed in the Three Groups of Subjects
(A) CBF increases. Activations of the right striate and extrastriate cortices are observed in EBSP but not in the two other groups for the contrast of MSL minus its control task. Upper image series, sagittal slices; lower image series, coronal slices. X and Y coordinates refer to standardized stereotaxic space. (B) Behavioral data. Behavioral results in MSL task (with SE bars). The dashed lines represent the ideal performance, whereas the solid lines indicate the best linear fit to the observed localization performance. Negative angles on the abscissa correspond to the obstructed ear, while positive angles correspond to the unobstructed ear. Note the better performance of the EBSP group compared to the EBNP and SIG.
Figure 2
Figure 2. Binaural Sound Localization in PET Experiments Performed in the Three Groups of Subjects
(A) CBF decreases. In the sagittal (upper image series) and coronal (lower image series) slices, a decreased CBF is observed in the visual cortex of SIG (striate and extrastriate cortices), for the contrast of BSL minus its control task. X and Y coordinates refer to standardized stereotaxic space. (B) CBF increases. In the sagittal (upper image series) and coronal (lower image series) images, a CBF activation peak is seen in the right ventral extrastriate cortex for the EBSP group, but not for the other two groups, for the contrast of BSL minus its control task. (C) Behavioral data. Behavioral results in the BSL task are presented (with SE bars). The dashed lines represent the ideal performance, and the solid lines indicate the best linear fit to the observed localization performance. All three groups were able to localize sounds accurately.
Figure 3
Figure 3. Intergroup Contrasts in Binaural Sound Localization Minus Control Task
Sagittal (top) and coronal (bottom) images showing the contrasts between EBNP (left) compared to SIG, and EBSP (right) compared to SIG. These contrasts confirmed the differences in occipital areas between the SIG and the two other groups, which are likely attributable to a decrease in CBF activity in the sighted relative to the control task (see Figure 2). X and Y coordinates refer to standardized stereotaxic space.
Figure 4
Figure 4. Intergroup Contrasts in Monaural Sound Localization Minus Control Task
Sagittal (top) and coronal (bottom) images showing contrasts between the EBSP and EBNP (left), and between the EBSP and SIG (right). These contrasts confirmed the differences in occipital areas between the EBSP group and the two other groups. X and Y coordinates refer to standardized stereotaxic space.
Figure 5
Figure 5. Correlational Analysis for Monaural Sound Localization in Blind Persons
These data show the correlational analysis between performance (mean absolute error) in pointing task to monaurally presented sounds and CBF in a group of blind subjects. The two columns of brain images (left image series, sagittal sections; right image series, coronal sections) illustrate the statistical parametric map of the correlation, which is maximal in the ventral extrastriate cortex (A) but also significant in dorsal extrastriate (B) and striate (C) cortices. The red arrows in the coronal slices indicate the focus selected for the respective sagittal slices. The scattergram shows the individual values extracted from each of these regions; closed circles indicate blind subjects; open circles indicate SIG. The dotted vertical line represents the cutoff in performance for the a priori classification of blind subjects into those with low error rates (EBSP) and those who do not show the enhancement (EBNP). X and Y coordinates refer to standardized stereotaxic space.

References

    1. Niemeyer W, Starlinger I. Do the blind hear better? II Investigations of auditory processing in congenital and early acquired blindness. Audiology. 1981;20:510–515. - PubMed
    1. Muchnick C, Efrati M, Nemeth E, Malin M, Hildesheimer M. Central auditory skills in blind and sighted subjects. Scand Audiol. 1991;20:19–23. - PubMed
    1. Röder B, Gelmuth L, Rösler F. Semantic and morpho-syntactic priming in auditory word recognition in congenitally blind adults. Lang Cogn Processes. 2003;18:1–20.
    1. Bull R, Rathborn H, Clifford BR. The voice recognition accuracy of blind listeners. Perception. 1983;12:223–226. - PubMed
    1. Hull T, Mason H. Performance of blind children on digit-span tests. J Vis Impair Blindn. 1995;89:166–169.

Publication types