Effects of functional group position on spatial representations of aliphatic odorants in the rat olfactory bulb
- PMID: 15678475
- PMCID: PMC2222918
- DOI: 10.1002/cne.20415
Effects of functional group position on spatial representations of aliphatic odorants in the rat olfactory bulb
Abstract
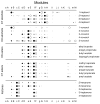
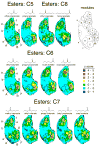
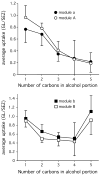
Principles of olfactory coding can be clarified by studying the olfactory bulb activity patterns that are evoked by odorants differing systematically in chemical structure. In the present study, we used series of aliphatic esters, ketones, and alcohols (27 odorants total) to determine the effects of functional group position on glomerular-layer activity patterns. These patterns were measured as uptake of [(14)C]2-deoxyglucose and were mapped into standardized data matrices for statistical comparison across different rats. The magnitude of the effect of position differed greatly for the different functional groups. For ketones, there was little or no effect of position on evoked patterns. For esters, uptake in individual glomerular modules increased, whereas uptake in others decreased with changing group position, yet the overall patterns remained similar. For alcohols, group position had a profound effect on evoked activity patterns. For example, moving the hydroxyl group in either heptanol or nonanol from the first to the fourth carbon changed the activity patterns so greatly that the major areas of response did not overlap. Within every functional group series, however, responses were globally chemotopic, such that pairs of odorants with the smallest difference in functional group position evoked the most similar patterns. These results help to define further the specificities of glomeruli within previously described glomerular modules, and they show that functional group position can be an important feature in encoding an odorant molecule.
Figures


Similar articles
-
Interactions between odorant functional group and hydrocarbon structure influence activity in glomerular response modules in the rat olfactory bulb.J Comp Neurol. 2005 Mar 7;483(2):205-16. doi: 10.1002/cne.20409. J Comp Neurol. 2005. PMID: 15678471 Free PMC article.
-
Chemotopic representations of aromatic odorants in the rat olfactory bulb.J Comp Neurol. 2006 Jul 20;497(3):350-66. doi: 10.1002/cne.20982. J Comp Neurol. 2006. PMID: 16736464 Free PMC article.
-
Local and global chemotopic organization: general features of the glomerular representations of aliphatic odorants differing in carbon number.J Comp Neurol. 2004 Dec 6;480(2):234-49. doi: 10.1002/cne.20335. J Comp Neurol. 2004. PMID: 15514935
-
Chemotopic odorant coding in a mammalian olfactory system.J Comp Neurol. 2007 Jul 1;503(1):1-34. doi: 10.1002/cne.21396. J Comp Neurol. 2007. PMID: 17480025 Free PMC article. Review.
-
The olfactory bulb: coding and processing of odor molecule information.Science. 1999 Oct 22;286(5440):711-5. doi: 10.1126/science.286.5440.711. Science. 1999. PMID: 10531048 Review.
Cited by
-
Odorants with multiple oxygen-containing functional groups and other odorants with high water solubility preferentially activate posterior olfactory bulb glomeruli.J Comp Neurol. 2007 May 20;502(3):468-82. doi: 10.1002/cne.21322. J Comp Neurol. 2007. PMID: 17366613 Free PMC article.
-
Detailed Characterization of Local Field Potential Oscillations and Their Relationship to Spike Timing in the Antennal Lobe of the Moth Manduca sexta.Front Neuroeng. 2011 Oct 25;4:12. doi: 10.3389/fneng.2011.00012. eCollection 2011. Front Neuroeng. 2011. PMID: 22046161 Free PMC article.
-
Effect of aging on hedonic appreciation of pleasant and unpleasant odors.PLoS One. 2013 Apr 24;8(4):e61376. doi: 10.1371/journal.pone.0061376. Print 2013. PLoS One. 2013. PMID: 23637821 Free PMC article.
-
Structural spine plasticity: Learning and forgetting of odor-specific subnetworks in the olfactory bulb.PLoS Comput Biol. 2022 Oct 24;18(10):e1010338. doi: 10.1371/journal.pcbi.1010338. eCollection 2022 Oct. PLoS Comput Biol. 2022. PMID: 36279303 Free PMC article.
-
Sparse odor coding in awake behaving mice.J Neurosci. 2006 Aug 23;26(34):8857-65. doi: 10.1523/JNEUROSCI.0884-06.2006. J Neurosci. 2006. PMID: 16928875 Free PMC article.
References
-
- Bozza T, McGann JP, Mombaerts P, Wachowiak M. In vivo imaging of neuronal activity by targeted expression of a genetically encoded probe in the mouse. Neuron. 2004;42:9–21. - PubMed
-
- Cleland TA, Morse A, Yue EL, Linster C. Behavioral models of odor similarity. Behav Neurosci. 2002;116:222–231. - PubMed
-
- Coopersmith RM, Leon M. Enhanced neural response to familiar olfactory cues. Science. 1984;225:849–851. - PubMed
-
- Curran-Everett D. Multiple comparisons: philosophies and illustrations. Am J Physiol Reg Integr Comp Physiol. 2000;279:R1–R8. - PubMed
Publication types
MeSH terms
Substances
Grants and funding
LinkOut - more resources
Full Text Sources

