

Comparative analysis of protein coding sequences from human, mouse and the domesticated pig
- PMID: 15679890
- PMCID: PMC549206
- DOI: 10.1186/1741-7007-3-2
Comparative analysis of protein coding sequences from human, mouse and the domesticated pig
Abstract
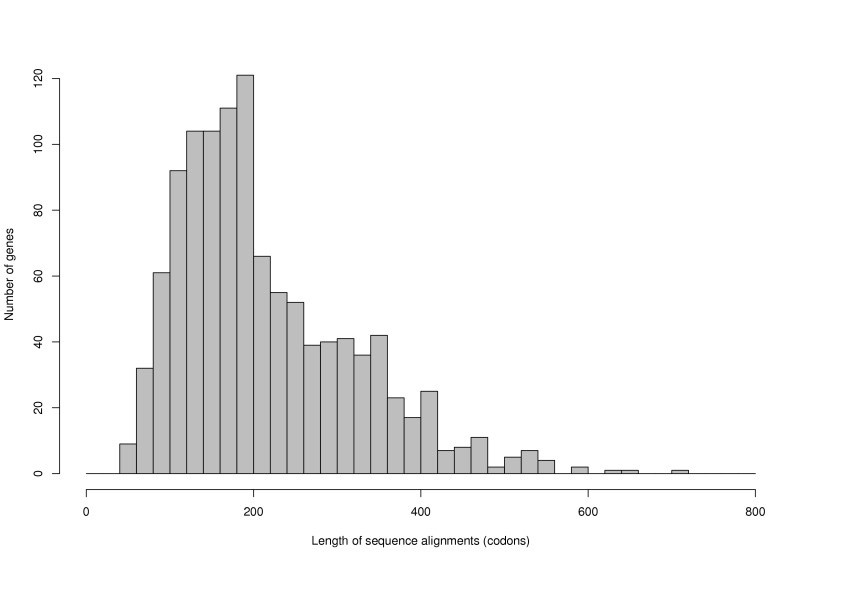
Background: The availability of abundant sequence data from key model organisms has made large scale studies of molecular evolution an exciting possibility. Here we use full length cDNA alignments comprising more than 700,000 nucleotides from human, mouse, pig and the Japanese pufferfish Fugu rubrices in order to investigate 1) the relationships between three major lineages of mammals: rodents, artiodactyls and primates, and 2) the rate of evolution and the occurrence of positive Darwinian selection using codon based models of sequence evolution.
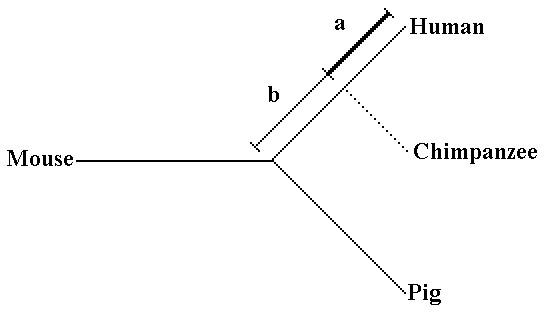
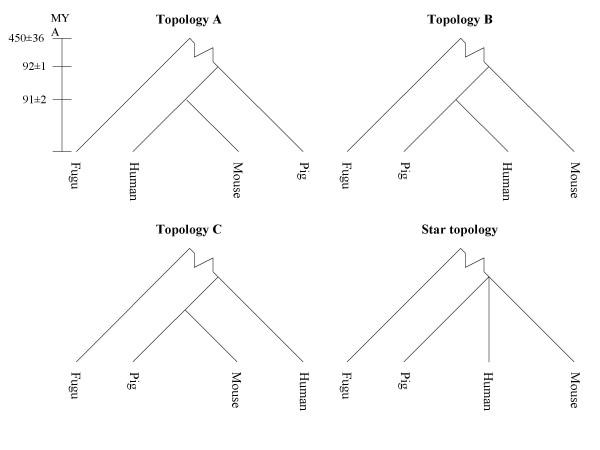
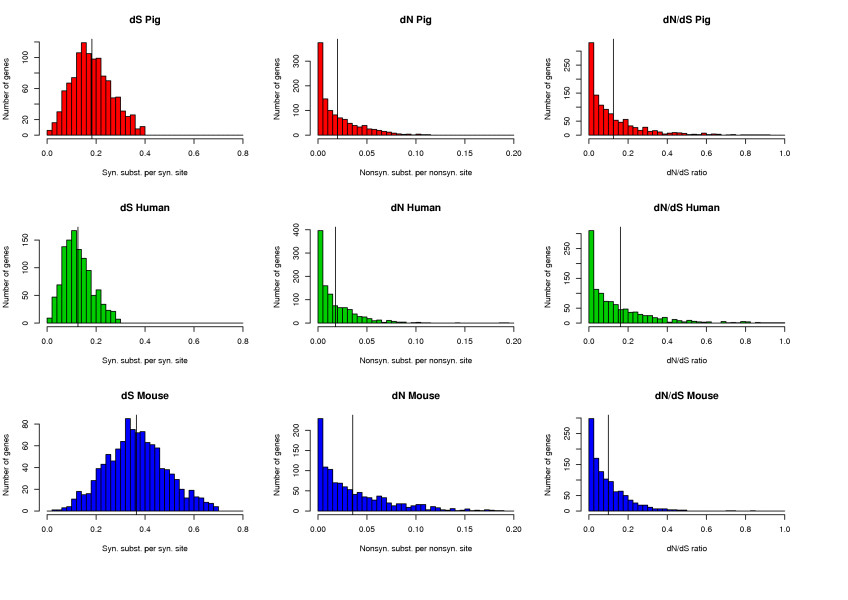
Results: We provide evidence that the evolutionary splits among primates, rodents and artiodactyls happened shortly after each other, with most gene trees favouring a topology with rodents as outgroup to primates and artiodactyls. Using an unrooted topology of the three mammalian species we show that since their diversification, the pig and mouse lineages have on average experienced 1.44 and 2.86 times as many synonymous substitutions as humans, respectively, whereas the rates of non-synonymous substitutions are more similar. The analysis shows the highest average dN/dS ratio in the human lineage, followed by the pig and then the mouse lineages. Using codon based models we detect signals of positive Darwinian selection in approximately 5.3%, 4.9% and 6.0% of the genes on the human, pig and mouse lineages respectively. Approximately 16.8% of all the genes studied here are not currently annotated as functional genes in humans. Our analyses indicate that a large fraction of these genes may have lost their function quite recently or may still be functional genes in some or all of the three mammalian species.
Conclusions: We present a comparative analysis of protein coding genes from three major mammalian lineages. Our study demonstrates the usefulness of codon-based likelihood models in detecting selection and it illustrates the value of sequencing organisms at different phylogenetic distances for comparative studies.
Figures
Similar articles
-
Resolving arthropod phylogeny: exploring phylogenetic signal within 41 kb of protein-coding nuclear gene sequence.Syst Biol. 2008 Dec;57(6):920-38. doi: 10.1080/10635150802570791. Syst Biol. 2008. PMID: 19085333
-
Positive selection during the diversification of class I vomeronasal receptor-like (V1RL) genes, putative pheromone receptor genes, in human and primate evolution.Mol Biol Evol. 2003 Nov;20(11):1805-10. doi: 10.1093/molbev/msg192. Epub 2003 Jun 27. Mol Biol Evol. 2003. PMID: 12832635
-
Divergence of conserved non-coding sequences: rate estimates and relative rate tests.Mol Biol Evol. 2004 Nov;21(11):2116-21. doi: 10.1093/molbev/msh221. Epub 2004 Jul 28. Mol Biol Evol. 2004. PMID: 15282332
-
Safety and nutritional assessment of GM plants and derived food and feed: the role of animal feeding trials.Food Chem Toxicol. 2008 Mar;46 Suppl 1:S2-70. doi: 10.1016/j.fct.2008.02.008. Epub 2008 Feb 13. Food Chem Toxicol. 2008. PMID: 18328408 Review.
-
The biochemical phylogeny of guinea-pigs and gundis, and the paraphyly of the order rodentia.Comp Biochem Physiol B. 1992 Apr;101(4):495-8. doi: 10.1016/0305-0491(92)90327-n. Comp Biochem Physiol B. 1992. PMID: 1611868 Review.
Cited by
-
Transcriptomic and proteomic profiling of two porcine tissues using high-throughput technologies.BMC Genomics. 2009 Jan 19;10:30. doi: 10.1186/1471-2164-10-30. BMC Genomics. 2009. PMID: 19152685 Free PMC article.
-
Pervasive positive selection on duplicated and nonduplicated vertebrate protein coding genes.Genome Res. 2008 Sep;18(9):1393-402. doi: 10.1101/gr.076992.108. Epub 2008 Jun 18. Genome Res. 2008. PMID: 18562677 Free PMC article.
-
Causes and evolutionary consequences of primordial germ-cell specification mode in metazoans.Proc Natl Acad Sci U S A. 2017 Jun 6;114(23):5784-5791. doi: 10.1073/pnas.1610600114. Proc Natl Acad Sci U S A. 2017. PMID: 28584112 Free PMC article.
-
Pigs in sequence space: a 0.66X coverage pig genome survey based on shotgun sequencing.BMC Genomics. 2005 May 10;6:70. doi: 10.1186/1471-2164-6-70. BMC Genomics. 2005. PMID: 15885146 Free PMC article.
-
The evolution of the macrophage-specific enhancer (Fms intronic regulatory element) within the CSF1R locus of vertebrates.Sci Rep. 2017 Dec 7;7(1):17115. doi: 10.1038/s41598-017-15999-x. Sci Rep. 2017. PMID: 29215000 Free PMC article.
References
-
- Thomas JW, Touchman JW, Blakesley RW, Bouffard GG, Beckstrom-Sternberg SM, Margulies EH, Blanchette M, Siepel AC, Thomas PJ, McDowell JC, Maskeri B, Hansen NF, Schwartz MS, Weber RJ, Kent WJ, Karolchik D, Bruen TC, Bevan R, Cutler DJ, Schwartz S, Elnitski L, Idol JR, Prasad AB, Lee-Lin SQ, Maduro VV, Summers TJ, Portnoy ME, Dietrich NL, Akhter N, Ayele K, Benjamin B, Cariaga K, Brinkley CP, Brooks SY, Granite S, Guan X, Gupta J, Haghighi P, Ho SL, Huang MC, Karlins E, Laric PL, Legaspi R, Lim MJ, Maduro QL, Masiello CA, Mastrian SD, McCloskey JC, Pearson R, Stantripop S, Tiongson EE, Tran JT, Tsurgeon C, Vogt JL, Walker MA, Wetherby KD, Wiggins LS, Young AC, Zhang LH, Osoegawa K, Zhu B, Zhao B, Shu CL, De Jong PJ, Lawrence CE, Smit AF, Chakravarti A, Haussler D, Green P, Miller W, Green ED. Comparative analyses of multi-species sequences from targeted genomic regions. Nature. 2003;424:788–793. doi: 10.1038/nature01858. - DOI - PubMed
Publication types
MeSH terms
LinkOut - more resources
Full Text Sources
Molecular Biology Databases
